

Gold prices rose on Tuesday and Wednesday before pulling back after the crucial US inflation data. Initially, the bullish move was subdued as most traders preferred to wait on the sideline. At the same time, the US presidential debate on Tuesday favored Kamala, leading to a drop in the dollar. This made gold cheaper for Read More…
Year: 2024
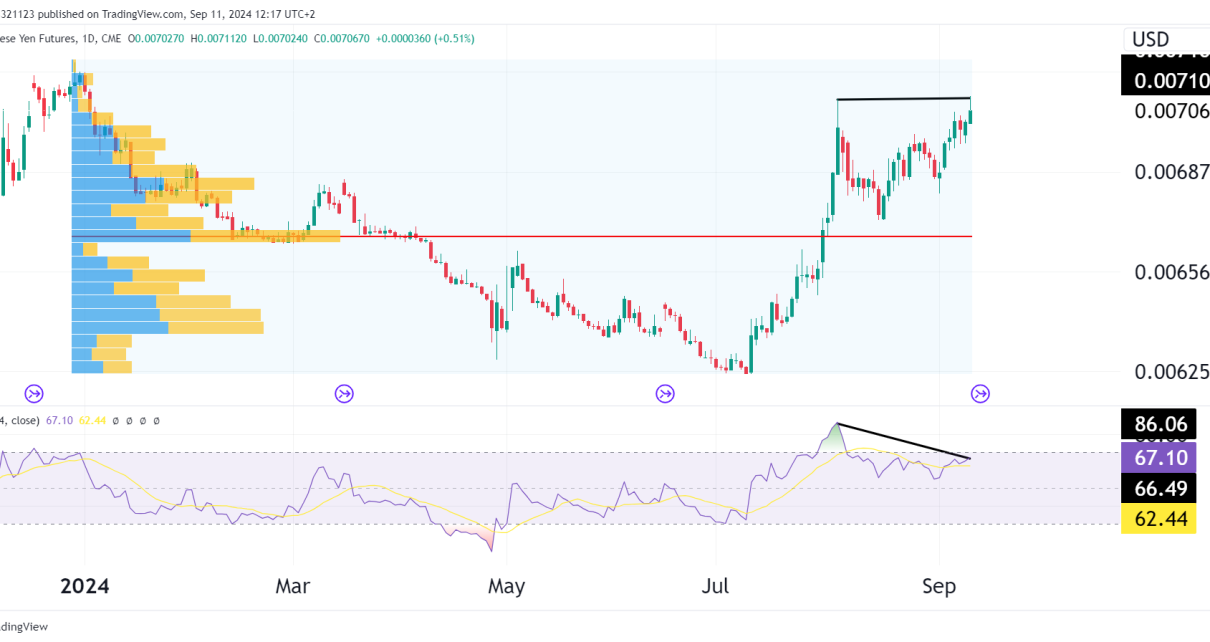
Japanese Yen Futures (CME, Daily Chart) Technical Analysis
Overview and Market Sentiment:Japanese Yen futures have been in a strong upward move since June 2024, but there are signs of potential exhaustion, with the formation of a double top near the 0.0071010 level. The double top pattern, combined with bearish divergence and the volume profile, sets us up for a potential short opportunity with Read More…
Equities Rebound 1% as Markets Brace for US Inflation Data
Equities rose 1% on Monday, recovering from last week’s plunge ahead of crucial US inflation data. Investors sold stocks the previous week due to fears about the economy after a set of poor reports. S&P 500 weekly change (Source: Bloomberg) Notably, the manufacturing and labor sectors showed weakness, creating economic uncertainty. However, by Monday, calm Read More…
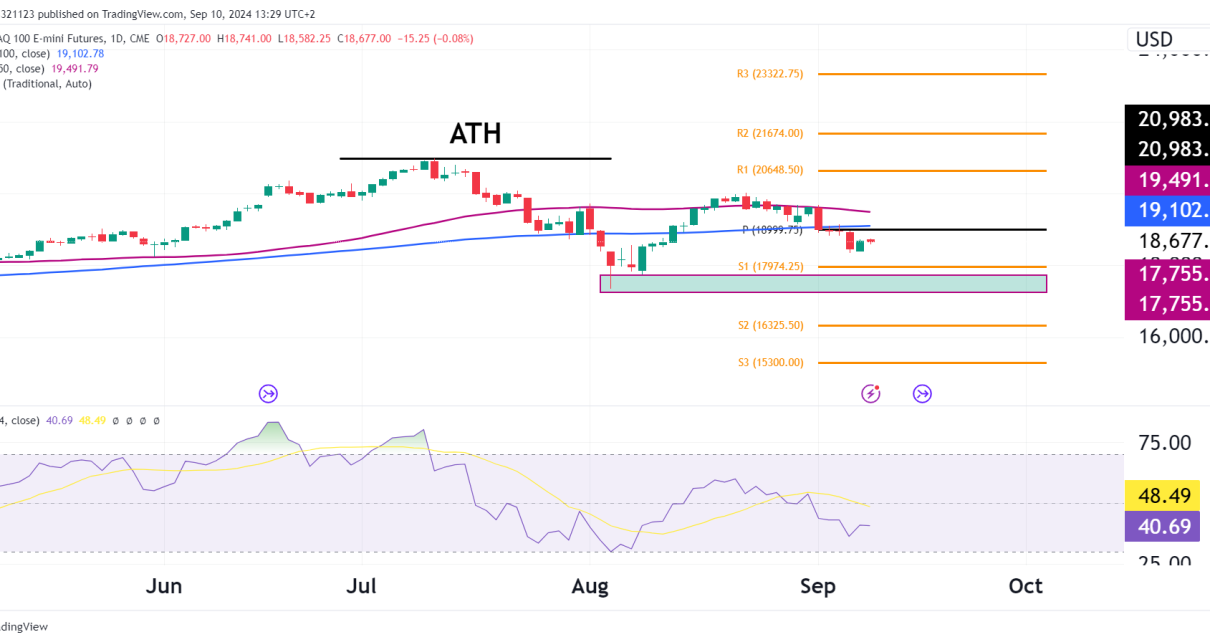
NASDAQ (NQ) ‘Only In Correction’ Technical Outlook
Overview and Market Sentiment:The NASDAQ 100 futures (NQ) have been in a strong long-term uptrend, gaining 22% for one year, but the recent pullback is raising caution among traders. The daily chart shows a technical retracement after reaching an All-Time High (ATH) earlier in the summer, and now the price is testing key support levels. Read More…

Gold Bull Flag ‘Strong’, Technical Outlook
Overview and Market Sentiment:Gold has been in a powerful uptrend this year, with the current chart showing the continuation of bullish momentum following a classic bull flag pattern formation. As of September 2024, Gold futures are trading at $2,528.4, up by 0.15% for the session, and showing no signs of immediate weakness. The key technical Read More…
Currency Futures Ease as NFP Data Supports Gradual Fed Rate Cuts
Most currency futures were on the back foot on Friday as the dollar whiplashed after a mixed monthly jobs report. The greenback ended higher as labor market data further eased fears of a recession and pointed to a gradual Fed rate cutting cycle. Last week, the US released several economic reports that gave an ambiguous Read More…

Interest Futures Climb Amid Mixed Economic Indicators
Interest futures rose on Thursday and Friday as the dollar and Treasury yields fell after a mix of economic indicators. Prices have rallied the whole week as investors increased the likelihood of a 50 bps Fed rate cut in September. A mix of data since Tuesday has led to a surge in Fed rate cut Read More…
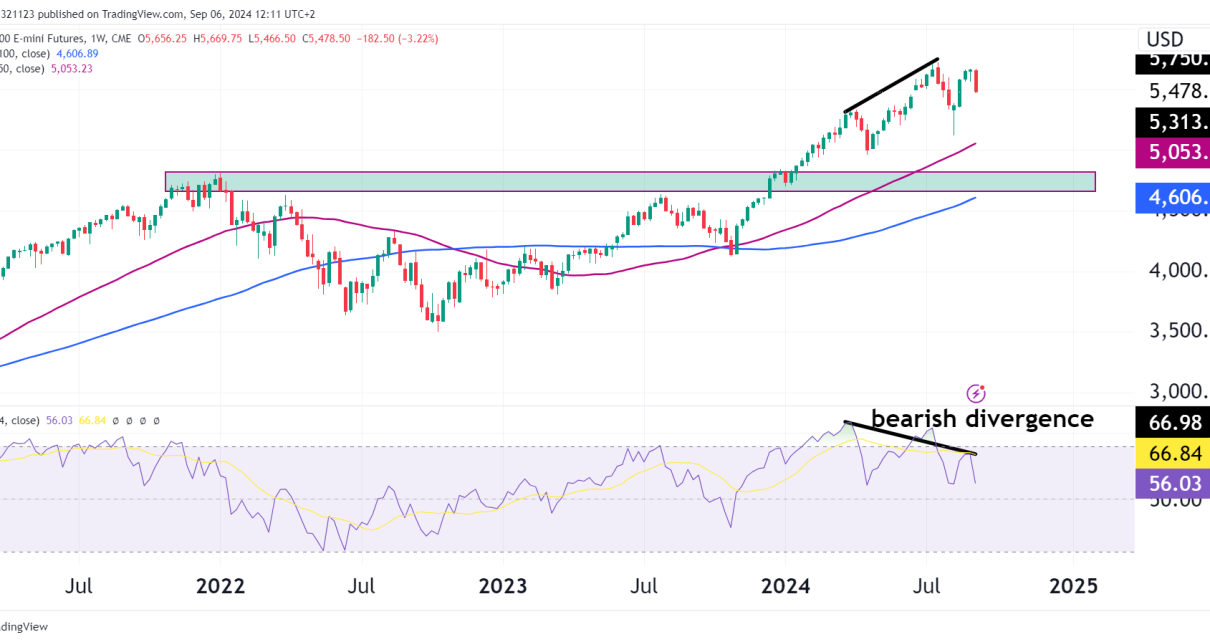
S&P 500 E-mini Futures (CME, Weekly Chart) Technical Analysis
Current Overview and Market Sentiment:The S&P 500 futures chart is showing signs of exhaustion after an impressive rally over the past two years. As we approach September 2024, the market is showing clear indications of bearish divergence, warning us of a possible trend reversal or significant correction in the coming weeks. Price Action: The S&P Read More…

Bitcoin Futures Technical Analysis (CME, Daily Chart)
Technical Analysis: Descending Channel: The primary structure in play is a descending channel, which has kept price action constrained between roughly $75,000 and $50,815. Until Bitcoin can decisively break out of this channel, the prevailing trend remains slightly bearish in the medium term but still bullish in th belong term. Potential Support Levels: Short-Term Outlook: Read More…
Oil Prices Stabilize After Tumbling on US Recession Fears
Oil prices recovered slightly on Thursday after collapsing in the previous sessions. Prices suffered on Tuesday and Wednesday as investors grappled with fears of a recession in the US. At the same time, a likely end to the dispute in Libya lowered the chances of a tighter market. On Tuesday, oil collapsed by 5% after Read More…