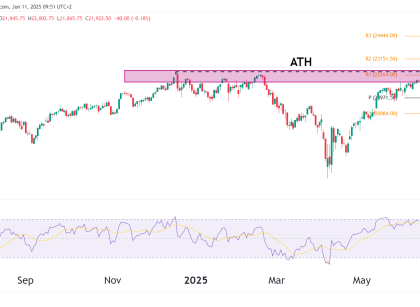
Crude Oil Futures
Fundamental Analysis

Oil Prices Hold Flat Amid US Holiday and Mixed Data

Oil prices held flat on Thursday as the US observed the Thanksgiving holiday. Moreover, US crude and gasoline inventories data in the previous session revealed a mixed picture of demand.  Data on Wednesday revealed that US gasoline inventories increased by 3.3 million barrels. Meanwhile, economists had expected a 46,000 barrel draw. At the same time, Read More…

gold technical analysis futures oneup trader funded trader program
Fundamental Analysis

Gold Bounces Back as Dollar Softens Before US Inflation Report

Gold rebounded on Wednesday as the dollar fell ahead of crucial US inflation data. In the previous two sessions, gold eased amid reports of a looming ceasefire in the war between Israel and Hezbollah. Moreover, Trump’s pick for the next US Treasury Secretary boosted the dollar and weighed on the yellow metal. The greenback paused Read More…

35% discount code OneUp Trader funded Trader program
Announcements

Exciting News: Get 35% Off OneUp Trader Evaluations!

Introduction Attention traders! OneUp Trader is running a limited-time promotion: 35% OFF on all regular evaluations. This is your chance to take advantage of our premium product at a fraction of the cost. You can redeem this code once per email, and you can get funded on up to three accounts at the same time! Read More…

world stocks recovery
Fundamental Analysis

US Equities Flat as Trump’s Tariff Policy Threatens Markets

The US equities gained on Monday amid optimism stemming from speculations about the Israel-Hammas ceasefire. However, the gains reversed and closed the day in negative territory. The US stocks stayed flat on Tuesday as investors went perplexed amid new tariff threats imposed by President-elect Donald Trump. Trump proposes 25% tariffs on imports from Canada and Read More…

gold technical analysis head and shoulders pattern
Technical Analysis

Gold Futures ($GC) Technical Analysis – November 25, 2024

Gold futures introduction Building on the November 7 analysis, where we discussed the potential Head and Shoulders (H&S) formation, today’s updated chart confirms resistance at $2,707.6, aligning with the Right Shoulder level. Gold remains in its ascending channel, but a breakdown of $2,542.3, the “Last Support,” would validate the H&S pattern, triggering a reversal with Read More…