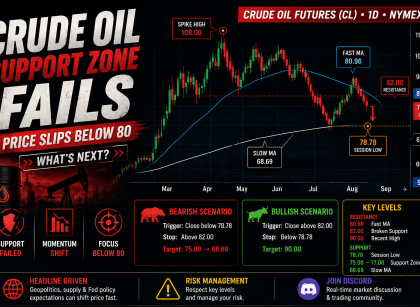
Introduction After holding the $88–90 support zone and working higher over the past couple of weeks, price has now pushed back toward the $102–105 resistance area, which has already rejected price once before. So structurally, not much has changed at the highest level. This is still a market trading inside a defined range. What has Read More…
Tag: Future Trading Strategies
Romanian Sales Professional Withdraws $43,100 Trading Multiple Funded Accounts
Introduction Laura has been trading for six years, balancing it alongside a full-time career in sales, a role that demands quick thinking, constant decision-making, and the ability to act under pressure. She carries that same mindset into her trading and primarily focuses on scalping the E-mini S&P 500 (ES) and the NASDAQ (NQ). Based in Read More…
Currency Futures Gain on Oil-Driven Inflation Fears
Currency futures strengthened last week as a surge in oil prices fueled inflation concerns. As a result, most major central banks that held policy meetings adopted a cautious tone. The rally in oil prices came as tensions in the Middle East intensified, with Trump rejecting Iran’s new proposal to end the war. It was a Read More…
S&P 500 Technical Analysis – 1 May 2026
Introduction A few days ago, we looked at ES and whether the price would be able to stay above the all-time high. Yesterday’s candle has given the bulls a very strong case with a rally of 1.6% on the day. Lets take a closer look at the technicals and what they are telling us. The Read More…
Interest Futures Set for Weekly Loss as Fed Outlook and Middle East Risks Weigh
Interest futures were heading for a bearish week on Friday as market participants grappled with escalating Middle East tensions and a less dovish Fed. Rising tensions in the Middle East sent oil prices higher, boosting Treasury yields. Meanwhile, some Fed policymakers took on a more hawkish tone during the FOMC meeting, increasing chances of rate Read More…
The Dollar Is Still Range Bound, Technical Analysis
Introduction For the past few weeks, DXY has been trading within a clear range between roughly 96.20 and 102.00. That structure is still intact. Nothing on this chart suggests a confirmed trend change. The rally we saw from the lows at the beginning of the year to 102 was driven by escalation in the Middle Read More…


