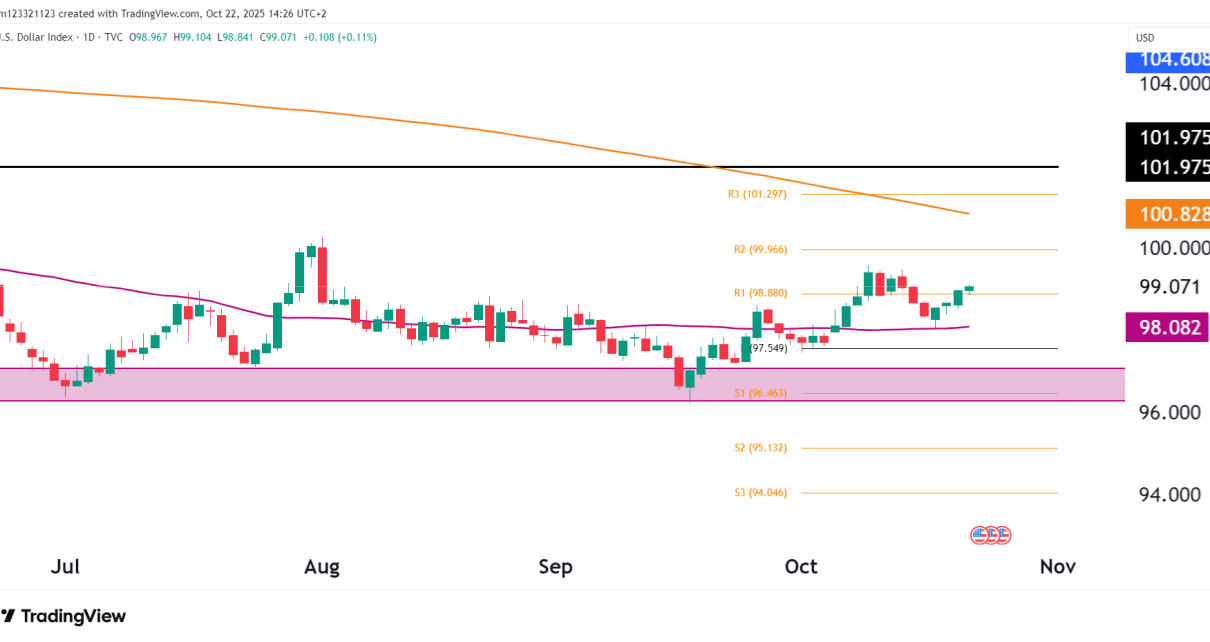
Introduction Crude oil is down 4% for the month and 10% for the year, and the technicals for now are signalling to sell. Price has bounced off the S2 level at 62.31 with a bullish engulfing, which bulls are hopeful for prices to move higher. Technical analysis The resistance at $68 is the first major Read More…
Technical Analysis
Gold Futures (GC) Technical Analysis, August 13 2025
Market Snapshot Metric Value Current Price 3,402.8 Day’s Change +3.8 (+0.11%) 50-Day MA 3,373.0 200-Day MA 3,037.4 Key Resistance 3,430–3,450 (ATH zone) Key Support 3,345–3,350 (trendline & 50DMA confluence) Technical Overview Trend & Structure Gold remains in a long-term uptrend, holding above its ascending trendline from the March lows. The recent push to new all-time Read More…
Euro Futures (6E) Technical Analysis, 12 August 2025
Market Snapshot Metric Value Current Price at time of writing 1.16395 50-Day MA 1.16444 200-Day MA 1.09894 Key Resistance 1.1700 – 1.1800 Key Support 1.15625 (range floor), 1.14250 (major swing low) Technical Overview Weekly Chart The weekly chart is a good way to show the strength of the long-term trend of any asset. The Dollar Read More…
Nasdaq Futures (NQ) Rally Continues, 11 August 2025
Introduction Nasdaq (NQ) futures are close to making new highs again after a short but sharp 4.4% pullback. Market Snapshot Metric Value Current Price As Of Article 23,738.50 Day’s Change +24.75 (+0.10%) 50-Day MA 22,707.56 200-Day MA 21,208.43 Pivot Point (P) 23,264.00 Key Resistance Levels 23,946 (R1), 24,527 (R2), 25,209 (R3) Key Support Levels 23,264 Read More…
Crude Oil Futures (CL) Technical Analysis, 8 August
Technical Overview Trend and Structure Momentum & Volatility Key Technical Levels Level Type Description 68.50 Pivot (P) Prior rejection level, key resistance 66.61 50DMA Broken support turned resistance 62.31 S2 First strong support test 59.94 S3 Critical downside level 71.62 R1 Bullish breakout reclaim level Probability Table Scenario Estimated Probability Commentary Continuation lower to test Read More…
S&P 500 (ES) Technical Analysis, 7 August 2025
Market Snapshot Metric Value Price as of 7 August 6,385.25 Day’s Change +14.25 (+0.22%) 50-Day MA 6,201.13 200-Day MA 5,940.58 14-Day RSI 59.02 Technical Overview Price Structure & Trend Momentum & RSI Key Technical Levels Level Type Significance 6,450–6,460 Resistance All-time highs zone 6,290–6,300 Support Recent low and short-term demand zone 6,201 50MA Strong trend Read More…


