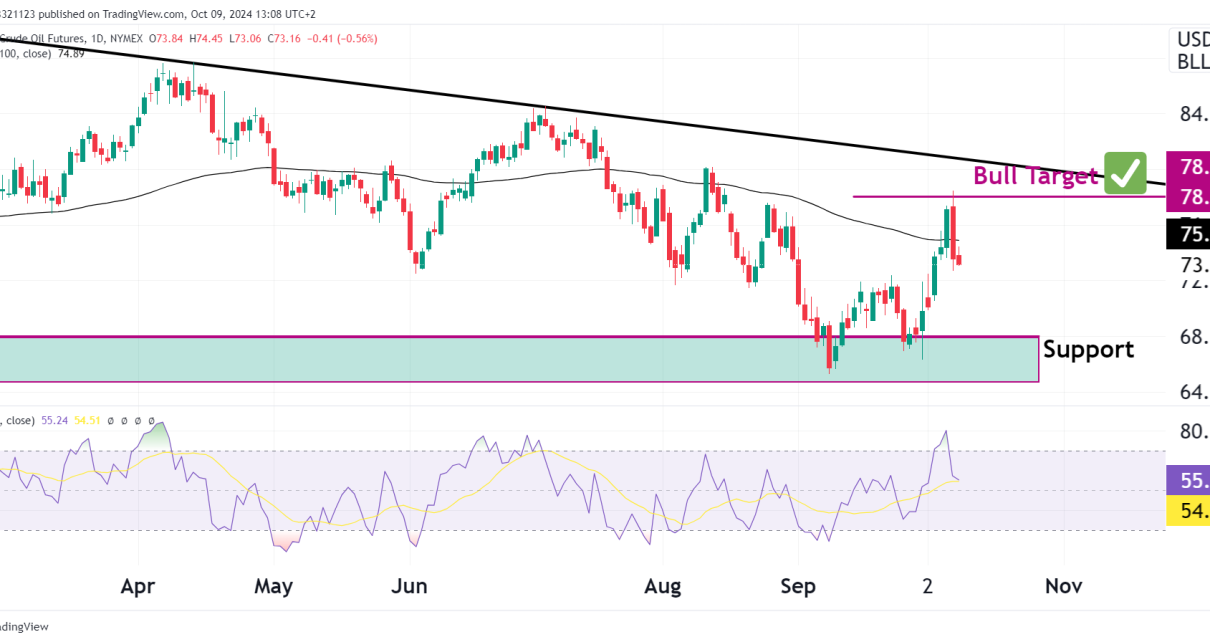
On Thursday, oil prices rose as the International Energy Agency and the OPEC producer group predicted robust growth in global oil demand. At the same time, severe winter weather disrupted US crude output. Moreover, the government reported a significant weekly decrease in crude inventories. There was a larger-than-expected draw in crude inventories, totaling 2.5 million Read More…
Analysis
Equities Dip as December Retail Sales Exceed Forecasts
On Wednesday, Wall Street equities closed lower as December US retail sales data beat expectations. These sales figures dampened hopes for an early start to the Fed’s rate-cut campaign in March. The optimistic sales report on Wednesday prompted economists to revise upward their growth estimates for the fourth quarter. Moreover, the report comes after solid Read More…
Gold futures (GC) MACD bearish, but POC bullish
Weekly Chart The weekly chart shows how significant the false break has been in GC with bulls still unable to push through. The recent ‘Failed Attempt’ to break above this level is beginning to show signs of exhaustion from the bulls. Immediate support is seen at the rising trendline, currently near the 1974.4 mark. A Read More…
Euro FX futures (6E) technical analysis trades both directions
Weekly Chart Analysis: The weekly chart exhibits a consolidation pattern with a clear ‘Point of Control’ at approximately 1.09220. This level represents the price with the highest volume traded over the analyzed period and acts as a significant area of balance between supply and demand. The presence of a ‘Low Volume Node’ below this range Read More…
Equities Retreat on ECB’s Rate Cut Warning
On Monday, European equities closed lower as government bond yields increased, following warnings from ECB officials against premature rate cuts. Meanwhile, the US equity market was closed due to a public holiday. Government bond yields rose across the region after ECB’s chief economist Philip Lane cautioned on Saturday that rapid rate cuts could lead to Read More…
Bullish price action in Dollar (DXY)
Weekly Chart We observe a clear support zone around the 102.00 level, which price is currently testing. If we see a strong bullish response at this zone, we could anticipate a rally towards the upper resistance near 114.90. However, a break below this support could lead us to look for further downside targets near the Read More…