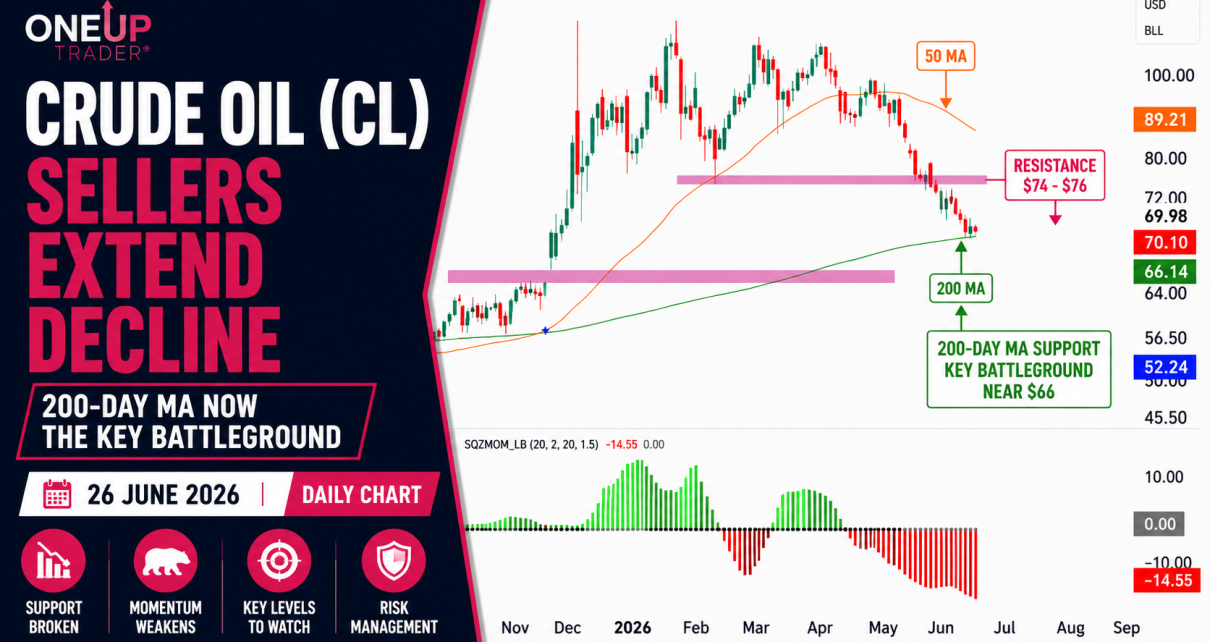
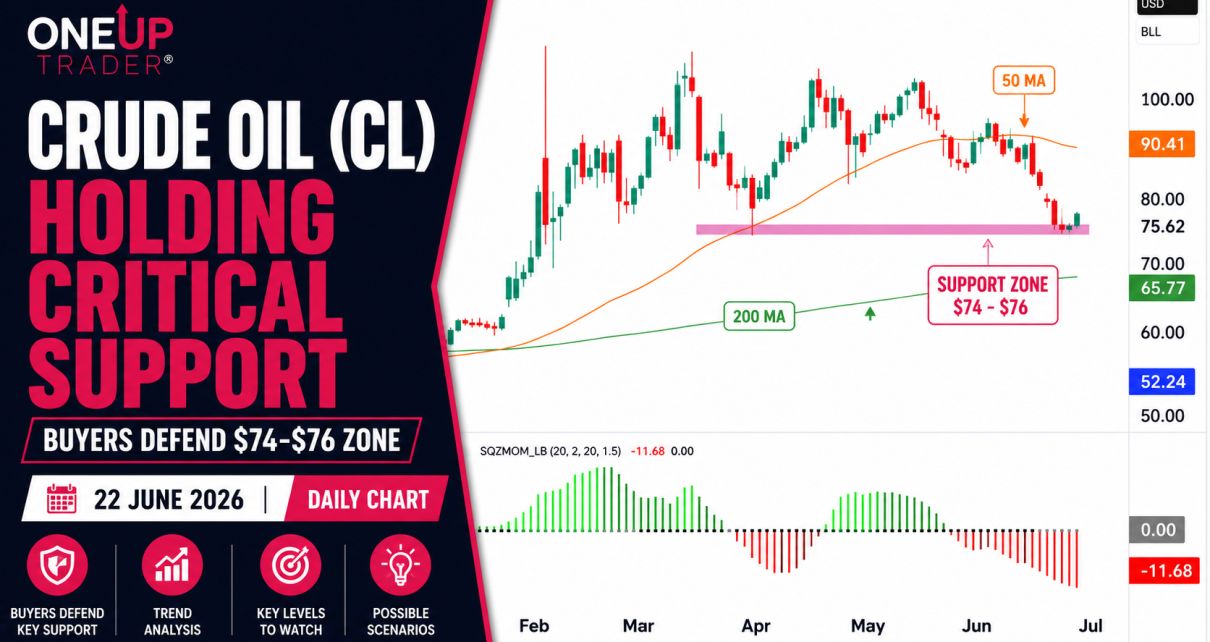
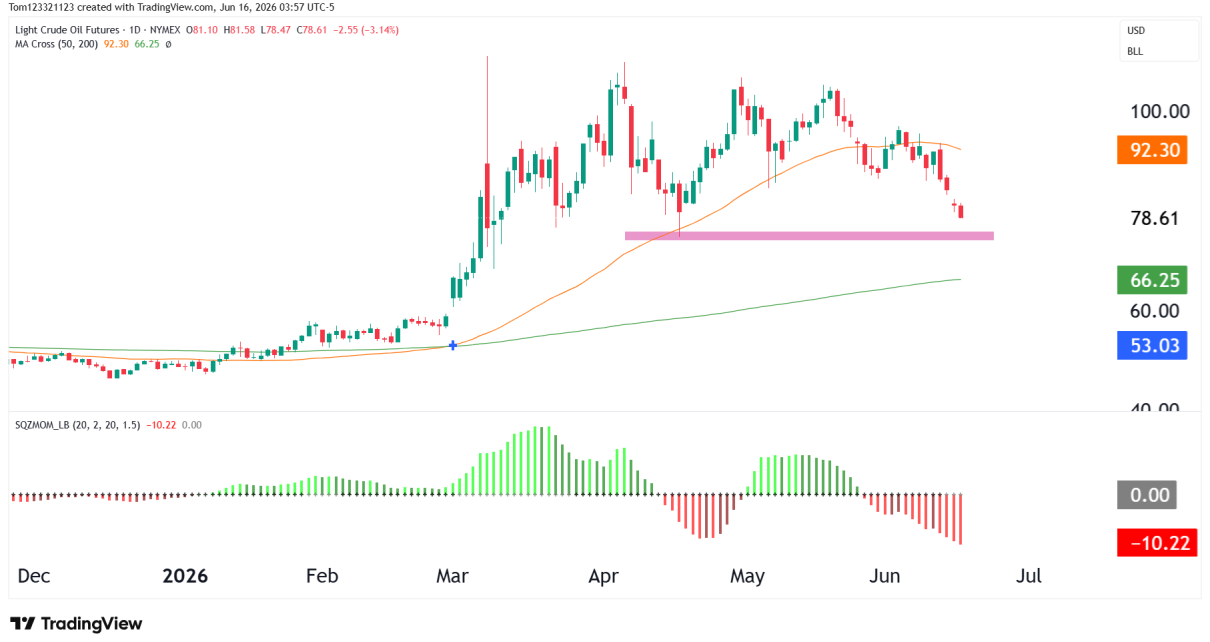
Author
Emilio Jay
Technical Analysis

Dow Futures Climb, Technical Analysis

Examining the weekly chart, the index has firmly established support within the 36,000 region, demonstrated by the green box marking previous resistance now turned support. The Relative Strength Index on the weekly timeframe reflects strong buying interest with a reading above 74. While this indicates a powerful bullish push, traders should be cautious of the Read More…

Technical Analysis

Gold Futures Shine, Technical Analysis Shows Strong Uptrend

Gold has always held a special allure, and in the financial markets, it is no different. Currently, Gold Futures are exhibiting strength, as indicated by the recent push towards and beyond the $2,089 level as it broke above all-time highs. On the weekly chart, the precious metal has overcome significant resistance, marked by the ‘Previous Read More…

futures trading strategies for beginners
Technical Analysis

Bitcoin’s Rally Eyes $69k Peak as Bulls Charge

Bitcoin’s remarkable rally has the cryptocurrency community buzzing as it nears the previous all-time high (ATH) of approximately $68,900. A technical analysis of the daily and weekly charts reveals a sustained upward trend that invites optimism for continued bullish momentum. The daily chart showcases Bitcoin’s substantial break above both the 50-day Simple Moving Average (SMA) Read More…

E-mini S&P 500
Technical Analysis

S&P 500 E-mini Futures Reach for Record Highs

In an impressive display of bullish momentum, the S&P 500 E-mini Futures have charted a path toward new heights. As we analyze the current trend, it’s clear that the bulls have taken the reins, with the recent close above the critical support level of $4244.75 signaling confidence in the US economy. The key takeaway from Read More…

Technical Analysis

Technical Analysis for Gold Futures:

Weekly Key Levels to Watch on the Weekly: Daily Chart Observations: Key Levels to Watch on the Daily: Potential Trades: Given the current price action and the significance of the ATH level, we must be prepared for volatility and swift price movements. Traders should watch for a confirmed breakout or rejection at the ATH to Read More…

Funded Traders Interviews

From Evaluation Trader to Funded Success: Mahmoud’s Experience

When Egyptian trader Mahmoud Elbakry was looking to take his futures trading career to the next level, he knew he needed the right partner. After failed attempts with 4 other prop firms, he finally found the perfect fit with OneUp Trader. Within just 15 trading days, Mahmoud successfully passed his OneUp Trader evaluation and secured Read More…

Strategies

Average True Range Indicator

Average True Range Indicator Explained The average true range (ATR) is a technical analysis indicator that measures market volatility and helps determine trend strength. Also referred to as the ‘atr indicator’ or ‘atr average true range,’ it calculates the average range between high and low prices over a specified timeframe. The average true range indicator, Read More…

Nasdaq 100 index futures (NQ)
Technical Analysis

Technical Analysis for NASDAQ 100 E-mini Futures

Weekly Chart Key Levels to Watch on the Weekly: Daily Chart Key Levels to Watch on the Daily: Potential Trades: It’s essential to monitor these levels and adjust strategies accordingly. The rising wedge and RSI divergence should be watched closely for signs of a potential reversal. Remember to manage risks effectively, as markets can always Read More…

Technical Analysis

Dollar falling again? Technical outlook

Weekly Chart The U.S. Dollar shows a symmetrical triangle pattern, which is typically indicative of a continuation or a reversal pattern depending on the breakout direction. Price is sitting at the top end of the triangle and is also in a multi-year support/resistance zone. Key Levels to Watch on the Weekly: Daily Chart On the Read More…