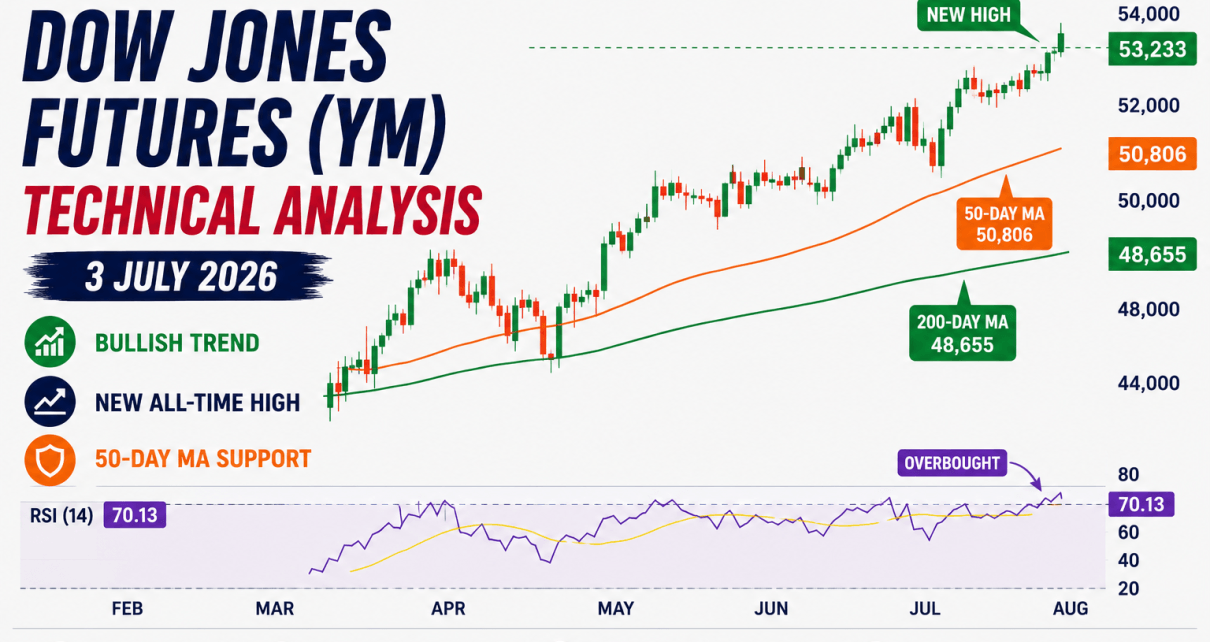
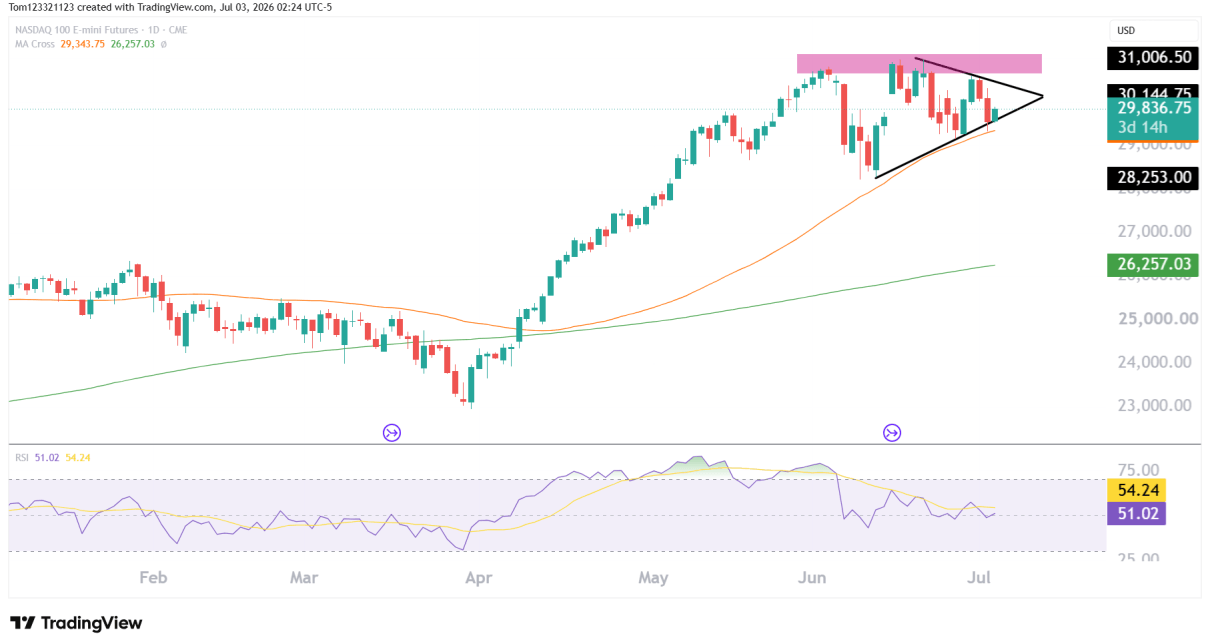
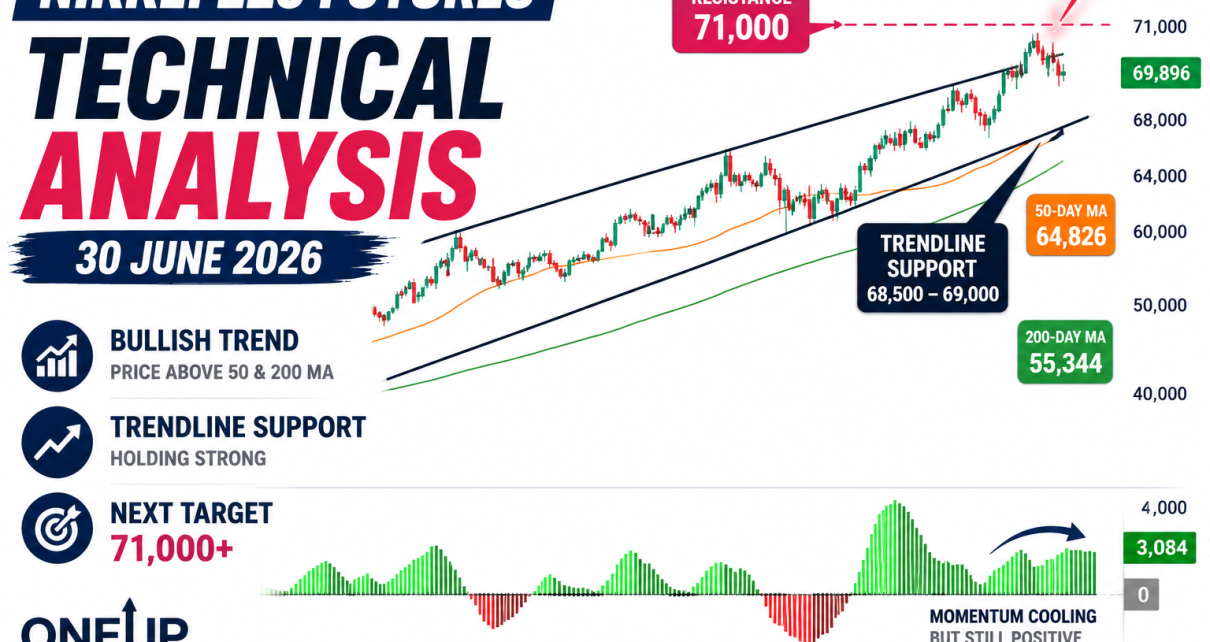
Author
Emilio Jay
Crude Oil Futures
Technical Analysis

Crude Oil Futures: Technical Outlook

Trade Opportunities and Levels to Watch: Support Levels: Resistance Levels: MACD Indicator: Volume: Trade Strategy: Stay vigilant for any signs of trend weakness or reversal, and remember that trading requires flexibility. If the market structure changes, be prepared to reassess your strategy and manage your positions accordingly. Always ensure your trades align with your risk Read More…

Strategies

Triangle Chart Pattern Trading Strategy

Introduction The triangle chart pattern is a popular technical analysis formation used by traders to identify potential trading opportunities. This pattern is formed by converging trendlines, creating a triangular shape on the price chart. There are different types of triangle patterns, including: This guide will provide an overview of the different triangle chart pattern trading Read More…

Nasdaq 100 index futures (NQ)
Technical Analysis

NASDAQ Futures (NQ) Trade Opportunities

Weekly Chart Analysis: Key Levels to Monitor: Daily Chart Analysis: Trade Strategy: Before entering any trade, confirm it aligns with your risk tolerance and trading plan. Monitor the trade actively, adjusting stop-losses and targets as the market moves. Stay informed and be ready to act on new information that could influence market direction.

crude oil futures
Technical Analysis Uncategorized

Crude Oil Futures (CL) show continued resilience

Light Crude Oil Futures have been showcasing resilience, marking an upward trajectory after a consolidation phase at a key support level. The weekly chart reveals a rally above the 40-week moving average. The price is trading within the Bollinger Bands, edging closer to the upper band. The RSI on both daily and weekly charts is Read More…

Technical Analysis

T-Bond Technical Analysis, Buying Still High

Monthly Chart Analysis:The long-term monthly trend has revealed a downward pressure since its peak around 2020. However, recent candles suggest a potential stabilization. The Momentum indicator has dropped into negative territory, which tells us there is a slowdown in the selling pressure. Daily Chart Analysis:Price action has settled around key moving averages as the battle Read More…

Nasdaq 100
Technical Analysis

NASDAQ Futures (NQ) Hit New ATH: Technical Analysis

Like most markets around the world at the moment, US equities are on a tear, especially after the rate data yesterday. It is really difficult to find a bearish opportunity in this market, which points us in the direction of ‘the trend is your friend’. Daily Chart:The market is trading within a rising channel, showing Read More…

futures trading strategies for beginners
Technical Analysis

Bitcoin pulls back, bulls buy it back: Technical Analysis

Daily Chart:A potential reversal candle is forming after the recent downturn we have seen in Bitcoin. The Awesome Oscillator shows a decrease in momentum, highlighted by the shrinking green bars turning red. BTC has been on a tear, up over 50% for the year. A pullback was going to come eventually but the question is Read More…

Technical Analysis

S&P 500 E-mini Futures Technical Analysis

Weekly Chart Analysis:ES is trading above its weekly pivot point, with immediate support at 4492.00 USD. The RSI is in the overbought territory, showing strong bullish momentum. The next resistance levels are R1 at 5169.50 USD and R2 at 5519.00 USD. Daily Chart Analysis:A potential bearish divergence is creating some worry for bulls as the Read More…

Crude oil (CL) futures
Technical Analysis

Crude Oil Futures (CL) Technical Analysis

Crude Oil Weekly Chart The weekly shows significant support around the $67 level, which has been tested multiple times since mid-2021, establishing it as a ‘Huge Support’ zone. The volume profile on the left shows a lot of trading activity around these levels, painting the point of control within that support zone. Bears have not Read More…