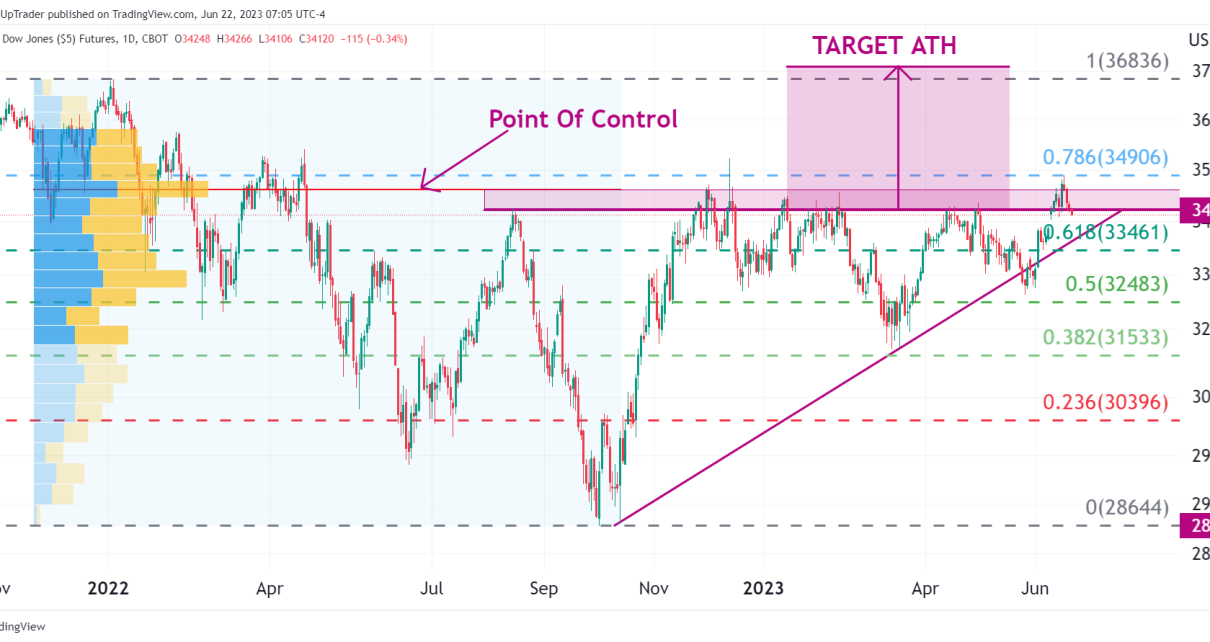
The daily trend is still bearish Price consolidating around the $1 level Range-bound trading opportunities on the 2-Hour Chart Introduction Because of the worse-than-expected CPI data and a strong Dollar, we can take advantage of many potentially good trades available in the markets currently. The fear of an economic crash in Europe is rising due Read More…
E-mini S&P 500 (ES): Technical Outlook
Signs of rolling over effect on the weekly chart Consumer Price Index (CPI) report is bearish for markets in general Bull case: Support band+point of control volume profile Weekly Chart Notice on the chart below how we see a rolling effect as prices retrace after a sharp move down. When we see these patterns form, Read More…
Technical Outlook: Gold Futures (GC)
Gold trading inside minor and major support zones Gold Sell off as Dollar rallies after CPI report Volatile market conditions expected The Daily Support Zone Last week we spoke about the major support zone in GC in this article. We still find a lot of buy support happening at this level even after a major Read More…
Crude Oil Futures (CL) Reverses Bearish Course
Prices rally to trade within the consolidation zone Price potentially targeting the 50 Moving Average on daily time frame. Daily Trend The daily chart shows a steady downward trend since June with prices bouncing predictably within a channel as shown in our analysis below. The market could be targetting the 50 moving average where we Read More…
E-mini Nasdaq 100 Futures (NQ): Technical Analysis Recap
Prices rally through minor resistance 38% Fibonacci target level reached Bullish Engulfing Candle forms on the Weekly Chart Bullish Weekly Engulfing Candle Last week’s trade saw a bullish engulfing candle close on NQ after three consecutive weeks of red candles. The entire candle has traded below and above the previous week’s trading range and closed Read More…
Technical Outlook: E-mini Nasdaq 100 Futures (NQ)
A bullish breakout has occurred above the minor consolidation zone Bearish and Bullish Targets Clearly Defined A Gap opens at $12,349.25 Bullish Breakout The minor consolidation referenced in our previous technical outlook has been broken to the upside and is trading above the Fibonacci 50% level. For Bulls, the next target to watch is the Read More…
Crude Oil Futures (CL) Breaks Below Consolidation Zone
The consolidation zone is broken to the downside Four consecutive red candles forms on the monthly chart Bears targetting $78.49 Monthly Candles September candle has opened red, forming the fourth monthly red candle in a row so far. We can connect a trend line from the November 2nd low to the December 1st low, which Read More…
Technical Outlook on Gold Futures (GC)
Major Support Zone Proving to be strong on the Daily chart Downtrend Channel on the 2-hourly chart Potential 1-2-3 Reversal pattern on Daily Chart What Has Happened? Since August 31, we expected some strong support around the $1,715.3 level; we have seen that play out now with bids coming in the past week as the Read More…
E-mini Nasdaq 100 (NQ): Head and Shoulders Pattern Completed
Head and shoulders (H&S) target hit RSI indicates selling pressure is weakening Cautiously bearish on NQ Refer to our analysis on August 30 for a detailed explanation of the Head and Shoulders (H&S) pattern formed on NQ which has been met. Normally, these patterns may get very close to the full target before consolidating or Read More…
Technical Outlook on Euro FX Futures (6E)
Euro trading below $1 for the first time since 2002 Bearish sentiment remains Potential bounce possible in the shorter term Consolidation zone on the hourly chart Rewind 2 weeks Looking back at the analysis we did on the Euro on August 19th, our call for the break below $1 has been realized. With such a Read More…