
Global Economic Growth Inflation and Monetary Policy Geopolitical Risks Regional Economic Outlooks
Author
Jay

Global Economic Growth Inflation and Monetary Policy Geopolitical Risks Regional Economic Outlooks

1. Gold Price Over Time This chart shows the historical trend of gold prices from 2000 to 2023. Over this period, the price of gold has seen a significant rally, with a notable rise around 2010, peaking at over $1,800 per ounce in 2011. This increase was driven by economic uncertainty and financial crises. After Read More…
Introduction The Nasdaq 100 futures are currently trading around 18,876.75. Over the past month, the index experienced a gain of approximately 5.76% since late April (Barchart.com). This performance is driven by strong corporate earnings from major tech companies like Nvidia and Microsoft, which have posted better-than-expected results. Nvidia’s surge of 9% following earnings and optimistic Read More…

A quick recap on our CL analysis done earlier in the week needs to be done as CL has failed to break below the support zone. The bulls stepped back in and the chart has put in a solid bottom candle formation. If we grind down to a shorter time frame, there is a false Read More…
All Time High Resistance ES bulls attempted to break above the all-time high but have failed with a nasty-looking daily candle for the 23rd. This could be an opportunity to short as there is also some small bearish resistance on the RSI. Long Trade Opportunities Short Trade Opportunities News Events Coming Up To Watch Consumer Read More…

According to the U.S. Energy Information Administration (EIA), crude oil prices are expected to average around $90 per barrel for the remainder of 2024, driven by OPEC+ production cuts and ongoing geopolitical risks. However, they anticipate a decline to an average of $85 per barrel in 2025 due to increasing global oil production (EIA Homepage) Read More…
Price Trends In 2024, the average price of Brent crude oil was around $82 per barrel, which is similar to the average in 2023. West Texas Intermediate (WTI) has also seen a comparable average, with current prices around $79 per barrel. Notably, prices have experienced short-term peaks and declines, with Brent crude hitting a high Read More…
Gold futures have experienced significant volatility in 2024, driven by economic and geopolitical factors. After closing 2023 at $2,135.39 per ounce, gold prices have continued to rise, reaching new highs. As of mid-May 2024, gold futures were trading around $2,316 to $2,322 per ounce, with fluctuations influenced by the strength of the U.S. dollar and Read More…
Introduction Based on the latest inflation data, the U.S. dollar is likely to remain stable or potentially strengthen in the near term. The slowing but steady inflation rate, coupled with the Federal Reserve’s decision to maintain interest rates at their current elevated level, could make the dollar more attractive to investors seeking a safe haven. Read More…
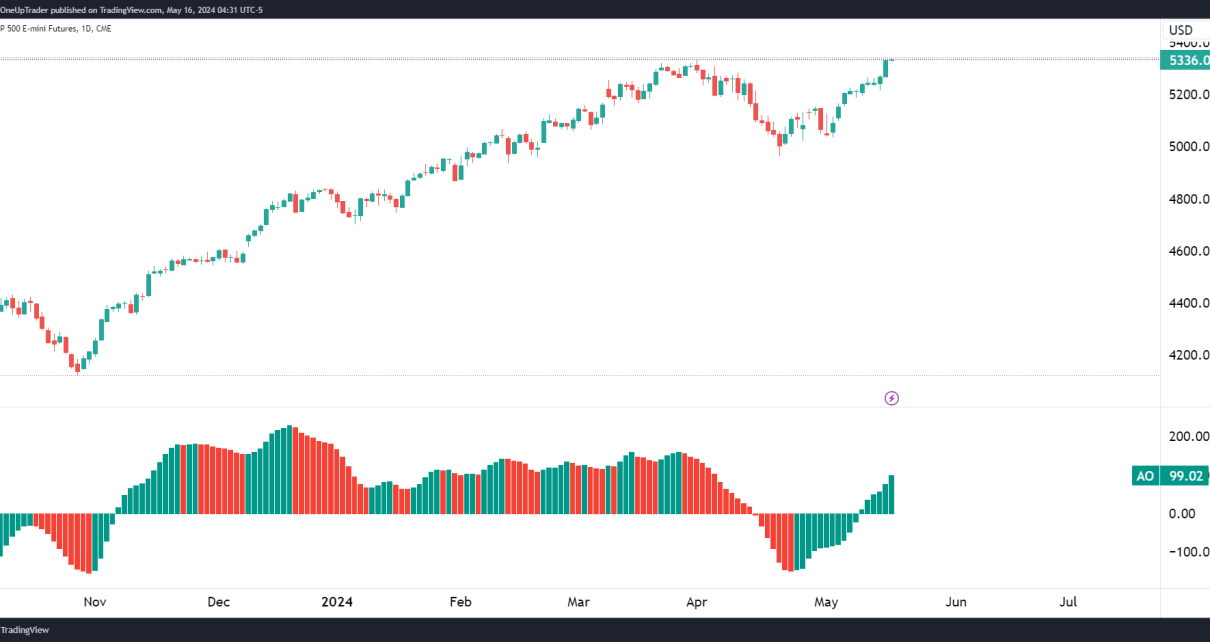
Introduction The S&P 500 Futures (ES) has rebounded from its recent 7% pullback and broke above the all-time high on May 15th. Technicals look bullish and follow a trend. We can begin grinding down to shorter time frames, avoid looking for shorts, and focus solely on looking for longs on our short-term strategies. Why Daily Read More…