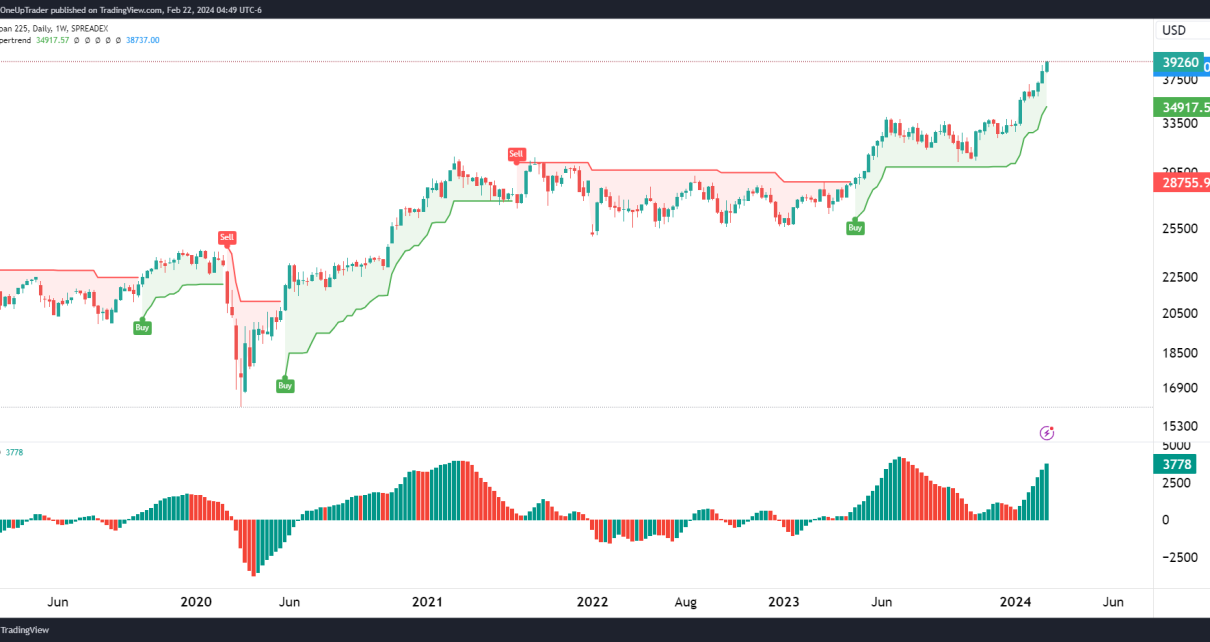
Weekly Key Levels to Watch on the Weekly: Daily Chart Observations: Key Levels to Watch on the Daily: Potential Trades: Given the current price action and the significance of the ATH level, we must be prepared for volatility and swift price movements. Traders should watch for a confirmed breakout or rejection at the ATH to Read More…
From Evaluation Trader to Funded Success: Mahmoud’s Experience
When Egyptian trader Mahmoud Elbakry was looking to take his futures trading career to the next level, he knew he needed the right partner. After failed attempts with 4 other prop firms, he finally found the perfect fit with OneUp Trader. Within just 15 trading days, Mahmoud successfully passed his OneUp Trader evaluation and secured Read More…
Average True Range Indicator
Average True Range Indicator Explained The average true range (ATR) is a technical analysis indicator that measures market volatility and helps determine trend strength. Also referred to as the ‘atr indicator’ or ‘atr average true range,’ it calculates the average range between high and low prices over a specified timeframe. The average true range indicator, Read More…
Technical Analysis for NASDAQ 100 E-mini Futures
Weekly Chart Key Levels to Watch on the Weekly: Daily Chart Key Levels to Watch on the Daily: Potential Trades: It’s essential to monitor these levels and adjust strategies accordingly. The rising wedge and RSI divergence should be watched closely for signs of a potential reversal. Remember to manage risks effectively, as markets can always Read More…
Dollar falling again? Technical outlook
Weekly Chart The U.S. Dollar shows a symmetrical triangle pattern, which is typically indicative of a continuation or a reversal pattern depending on the breakout direction. Price is sitting at the top end of the triangle and is also in a multi-year support/resistance zone. Key Levels to Watch on the Weekly: Daily Chart On the Read More…
Light Crude Oil Futures: Technical Outlook
Weekly Chart AnalysisThe Light Crude Oil Futures on the weekly chart have a clear consolidation pattern within a defined support zone. Volume Profile Visible Range (VPVR) indicates substantial trading activity at these levels. The Relative Vigor Index (RVI) is setting a steady momentum, with the RVI line slightly above its moving average, indicating a slight Read More…
Andrews Pitchfork Trading Strategies
Andrews Pitchfork Andrews Pitchfork is a technical analysis indicator developed by Dr. Alan Andrews in the 1960s. It has become a widely used tool among traders and technical analysts. The indicator consists of three parallel trendlines drawn on a price chart. The middle trendline connects two extreme points, usually a peak and a trough. The Read More…
Nasdaq Futures Jump as NVIDIA reports earnings
Nasdaq futures jumped approximately 2% Thursday morning following a strong earnings report from Nvidia, a leader in AI chip design. The company exceeded Q4 revenue expectations and projected Q1 revenue to triple, fueled by robust demand for its artificial intelligence chips. In premarket activity, Nvidia shares skyrocketed 12.9%, poised to add over $200 billion to its market Read More…
Nikkei 225 surges; technical outlook
Weekly The weekly chart of the Nikkei Futures has been in a strong uptrend, as indicated by the SuperTrend indicator, which has been green for an extended period. The Awesome Oscillator (AO) is positive too as the Japanese index surges to new highs. Key Levels to Watch on the Weekly: Daily On the daily chart, Read More…
Japan’s Nikkei Soars to Peaks Unseen Since 1980s
Japan’s stock market has reached new heights not seen since the country’s asset bubble in the late 1980s. Back then, share prices soared to astronomical levels, fueling a national mood of affluence and speculation. 87-year-old investor Kazukuni Yamazaki recalls the spectacle of daily stock fluctuations drawing crowds of eager onlookers, including young office workers. Luxury Read More…


