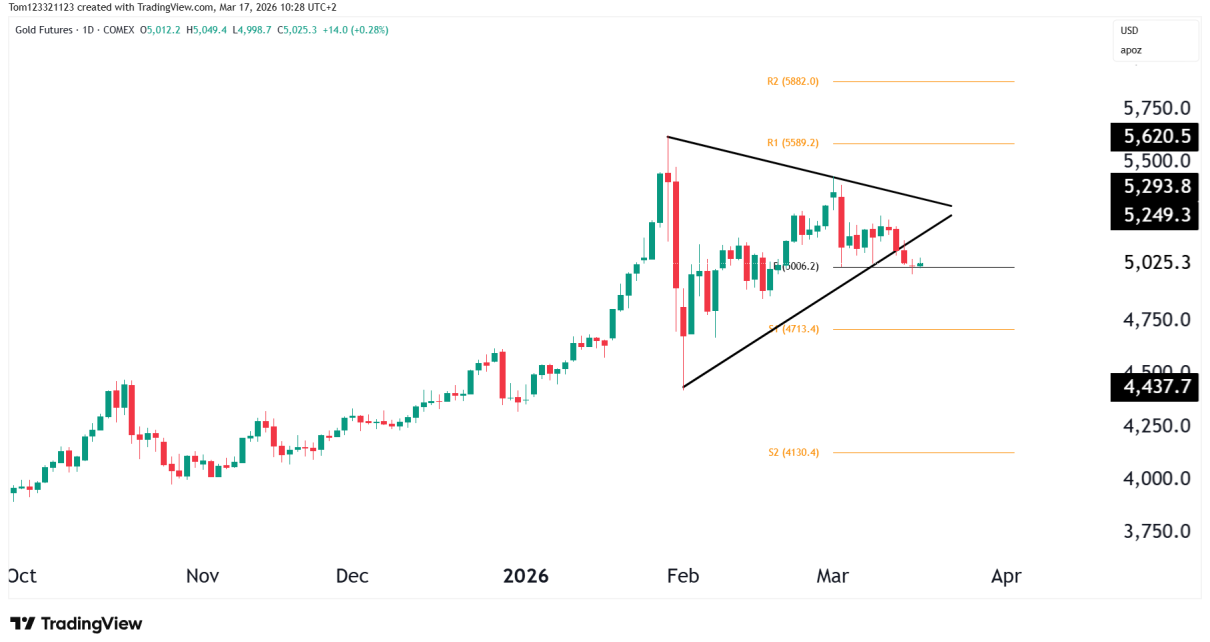
Technical Breakdown Resistance Zone (22,264 – 22,425): MACD: Moving Averages: Outlook & Trade Setup: Term Bias Notes Short-Term (1–2 weeks) Cautious Bullish Price nearing ATH, but momentum is fading. Risk of rejection. Medium-Term (June–July) Bullish Breakout above ATH could trigger a run to 23,151 (R2) or 24,444 (R3). Long-Term Structural Uptrend Macro trend remains bullish Read More…
Crude Oil Surges on Geopolitical Shock, Technical Analysis
Current Price: $73.51Change: +0.73%Move from June low: ~$60.09 → ~+22% rally Key Technicals: Crude has triggered a high-momentum breakout from a zone where CL was consolidating for a long time. This wasn’t a grind higher, though; this was a news-driven surge with a technical structure now favoring trend continuation, but with risk of overextension. Middle Read More…
Dollar Technical Analysis – What’s Driving the Decline?
Price Action & Momentum Technically, DXY is in a confirmed bear trend. A sustained close below 97.93 would expose the 96.75 level next (S2). Reclaiming 100 would be necessary for bulls to regain control. Macroeconomic Pressures on the U.S. Dollar Rate Cut Expectations Soften Yield Appeal Twin Deficits – Fiscal and Current Account Political Uncertainty Read More…
Nasdaq Futures Technical Analysis 11 June 2025
Technical Overview Resistance Zone & ATH Key Pivot Levels Pivot Zone Price ATH / R1 22,425.75 R2 23,151.50 R3 24,444.00 Pivot (neutral) 20,971.50 S1 (support) 20,084.00 It looks like its just a matter of time before the price breaks above the high but nothing is certain in markets so we have to wait and see. Read More…
Gold Technical Analysis: Triangle Breakout, Eyes on $3,620
Chart Structure Symmetrical Triangle Previous Demand Zone Indicators RSI (14) Pivot Levels Level Description S1 $3,143 Key support/demand base Pivot $3,246 Inside triangle, base for breakout R1 $3,468 Initial resistance on breakout R2 $3,620 Primary measured target R3 $3,792 Stretch target if breakout is impulsive Market Context Trades Bullish Breakout Entry Failure Reversal Watch Bear/Bull Read More…
From Freelancer to Funded Trader: How Nicholas Mastered Bond Futures with OneUp Trader
Introduction Nicholas Patterson from Opelika, Alabama, completed his OneUp Trader evaluation in just 15 days and has been steadily improving ever since. At 33, he works as a freelancer in film and music production while still developing his bond trading strategy. “I enjoy the flexibility that comes with making a profit from the markets,” Nicholas Read More…
Crude Oil Technical Analysis, 6 June 2025
Technical overview Support & Resistance Zone/Level Description R1 ($64.89) Near-term resistance; price now testing. R2 ($68.98) Strong resistance; top of the supply zone. S1 ($56.00) Major support from mid-April low. Pivot ($60.09) Previous consolidation base. Highlighted Supply Zone Momentum & RSI The recent move marks a clear bullish structure of higher lows and higher highs. Read More…
Bitcoin Technical Analysis, 5 June 2025
Trend Structure Key Support Levels Level Comment 102,720 (Pivot) Immediate short-term support; being tested. 95,095 (S1) Stronger horizontal 85,060 (S2) Lower support level of the channel uptrend. Resistance Levels Level Comment 110,150 (ATH) Psychological and technical ceiling. 113,755 (R1) Short-term price rejection zone. 122,380 (R2) Upside breakout target post-ATH. Market Psychology Trade Setups Scenario A Read More…
Russell 2000 Lagging S&P 500, Technical Outlook 3 June 2025
RTY Underperformance Weekly Chart of RTY: Structure and Trend Bullish Observations: Caution: Daily Chart of RTY Moving Averages RSI (14) Structure Metric ES (S&P 500 Futures) RTY (Russell 2000 Futures) Trend (Weekly) Strong uptrend Sideways, potential reversal Proximity to ATH ~4% below ATH ~17% below ATH Daily Trend Bullish continuation Range/consolidation RSI Momentum (Daily) Above Read More…
Crude Oil Futures (CL) Technical Analysis, 2 June 2025
Technical Outlook Price Zones Moving Averages Bull and Bear Scenarios Bull Case Bear Case Trade Setups Range Breakout Buy Setup Range Support Bounce Outlook Summary Timeframe Bias Commentary Short-Term Consolidation Attempting breakout of range; test underway at $63 Medium-Term Neutral → Bullish MACD flip, but still under key MAs – breakout above $65 needed Long-Term Read More…