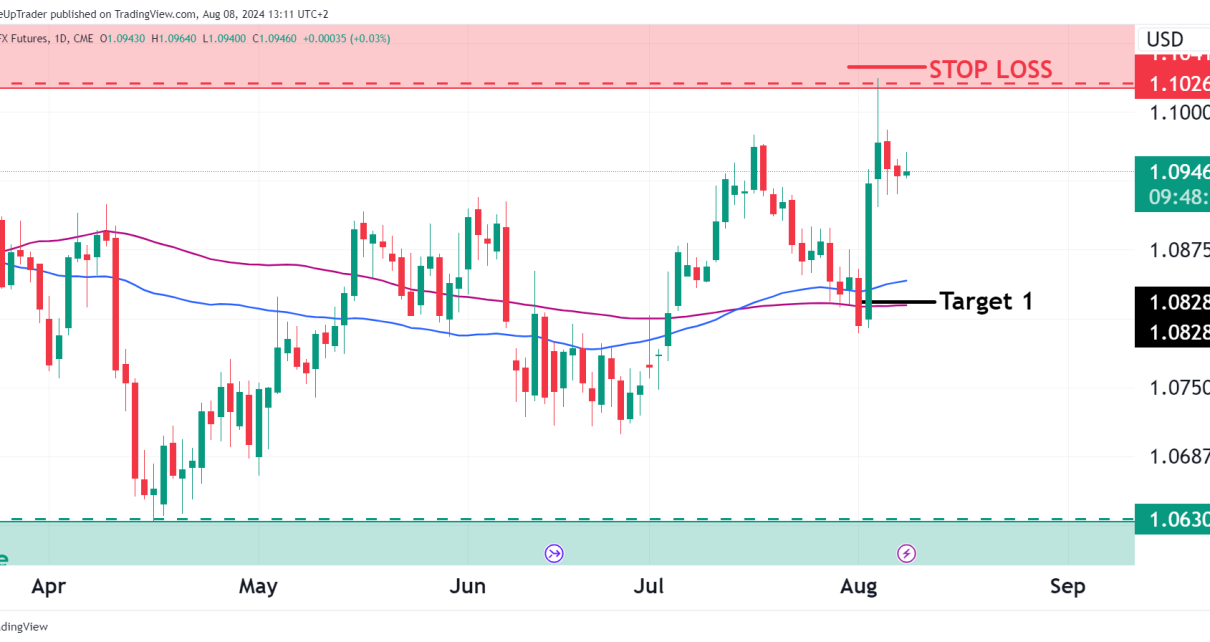
In this week’s technical analysis of Crude Oil we will look at the weekly and daily charts. CL is down 26% since its 2023 peak made in September of last year and is currently trading inside of a support zone. Let’s see what the charts say and if we can find some opportunities. Weekly Chart Read More…
Gold Futures (GC) approaches ATH again
After gold made an all-time high a few weeks ago, the yellow metal sold off, and the chart turned bearish very quickly. The bulls will be happy to see that the selling pressure has softened and a new rally has begun. GC is now getting very close to the previous all-time high, where we saw Read More…
Japanese Yen Futures (6J) Technical Analysis
The Dollar is weakening, and we are seeing a resurgence in currencies like the Yen. In this week’s technical analysis, we look at the weekly and daily time frames, indicators, and levels to watch. Weekly Chart: Daily Chart: Trade Ideas: Key Levels to Watch:
Double Top and Bottom Chart Patterns in Trading
Technical analysis patterns, including the double top and double bottom, provide savvy traders with a window into the psychology behind price movements. Skillfully leveraging these patterns could reap significant rewards. This guide will explore how to identify and utilize double tops and bottoms to improve your knowledge on chart patterns. The basics of the double Read More…
Bitcoin Futures: Key Levels to Monitor for Q1 2024
As we step into the first quarter of 2024, Bitcoin will be on the forefront of investing news as we await the bitcoin ETF. The price for BTC futures has seen a significant 162% YTD return. With the halving coming shortly, what do we expect for BTC? Here’s a technical breakdown of the current market Read More…
Euro FX Futures: Key Technical Levels and Trade Setups to Watch
As the Dollar continues to fall, eyes are on the Euro and how it will weigh up against the rest of the world currencies. In this week’s technical analysis, we take a look at the monthly, weekly, and daily charts. We also look for trade ideas and ways to play the market. Monthly Chart The Read More…
S&P 500 E-mini Futures: Key Levels and Trade Setups
Overview The charts below give us monthly, weekly, and daily S&P 500 E-mini Futures (ES) technicals. We will analyze the key levels, trends, and indicators to establish potential trade setups. Monthly Timeframe Analysis The monthly chart reveals a long-term uptrend, with the price consistently forming higher highs and higher lows—a bullish signal. The recent high Read More…
E-Mini Russell 2000 Futures (RTY) Technical Analysis
Introduction The E-Mini Russell 2000 Index Futures are approaching an all-time high (ATH). The technical analysis of both weekly and daily charts are catching up to the bigger indices that have already broken their previous highs. Weekly Chart Analysis On the weekly chart, we see that the RTY futures are within a symmetrical triangle pattern, Read More…
Gold Futures (GC) Technical Analysis Update
Introduction Gold Futures have shown remarkable resilience, breaking through a triple-top pattern and scaling above the previous all-time high in recent weeks. The only hurdle facing the bulls is the weekly bearish close from two weeks prior when price broke above the high, as we analyzed here. Weekly Chart Analysis The weekly chart illustrates a Read More…
New All-Time High In Nasdaq Futures (NQ)
Introduction NQ, like the rest of the world’s stock markets, is surging. Now trading at an all-time high. This week might be the first weekly close above the all-time high, which marks an incredible recovery after a 37% decline from its previous high back at the beginning of 2022. Let’s see what the charts tell Read More…