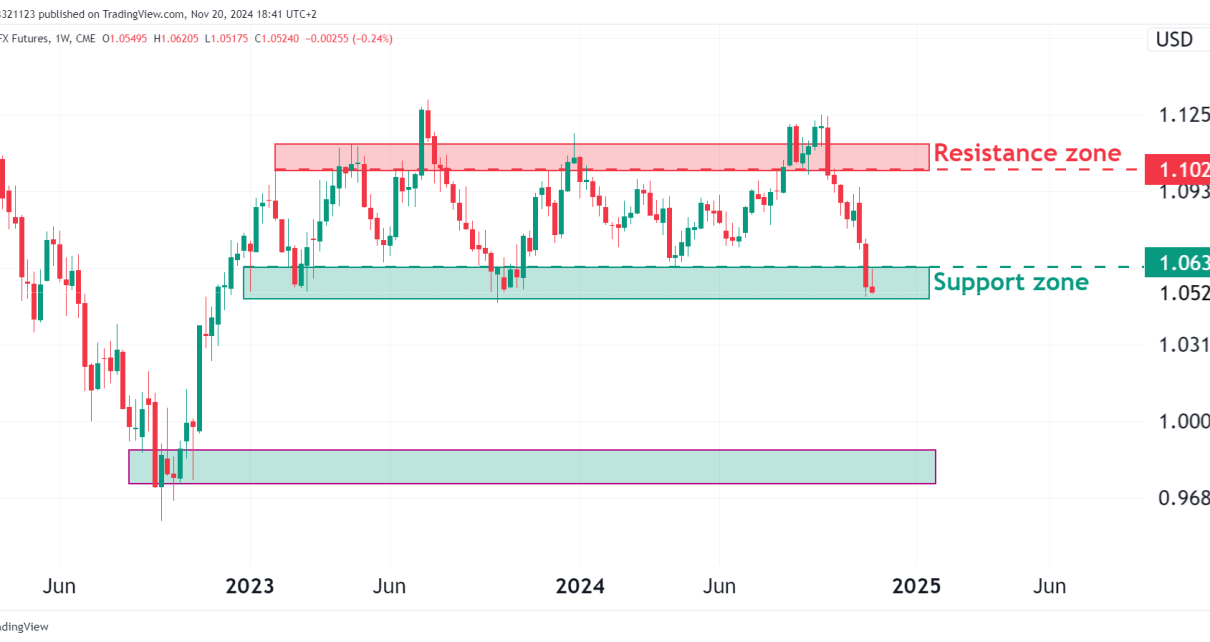
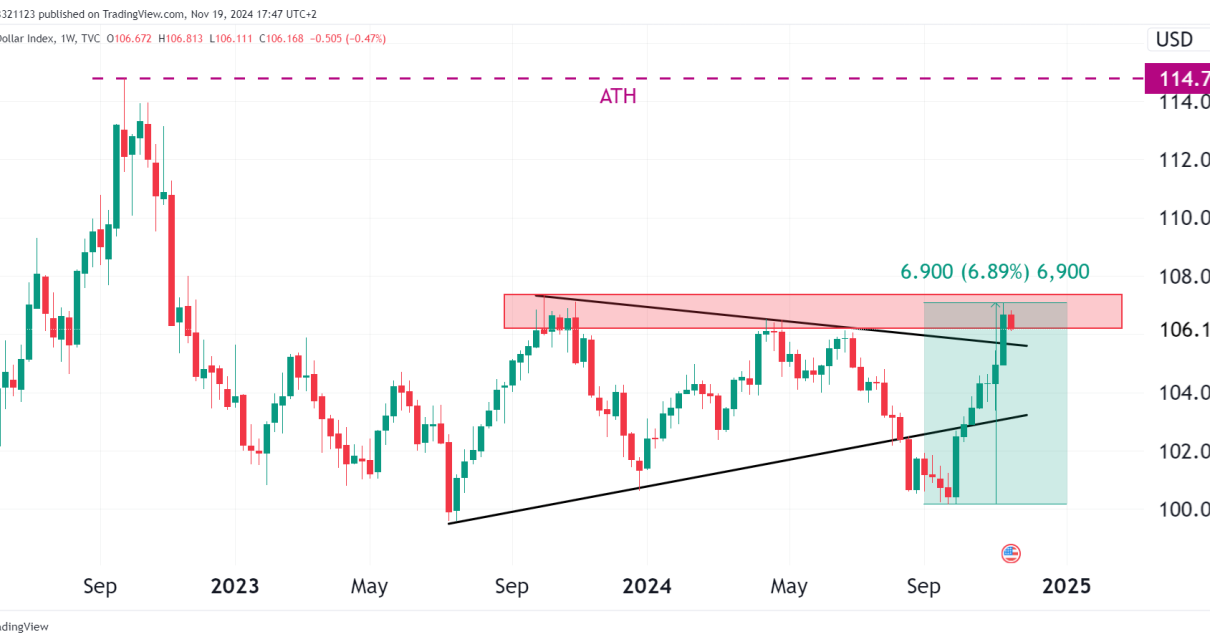
Key Updates For Gold Futures Current Prices and Trends: Gold futures are currently trading around $2,364.75 per ounce. The market has experienced some volatility, with prices ranging between $2,358.30 and $2,369.00 in recent trading sessions (Investing.com). Market Sentiment: Analysts note a bearish sentiment in the near term, with key support levels under threat. This outlook Read More…
The Fed, Quick Update on Policy
The Federal Reserve’s (Fed) updates on monetary policy highlight that the Federal Open Market Committee (FOMC) has decided to maintain the federal funds rate at the current range of 5.25% to 5.5% on May 2nd. The decision marks the sixth consecutive meeting where rates have been held steady, keeping them at the highest level in Read More…
Did S&P 500 (ES) Just Double-Top?
Introduction In our previous analysis on ES, we noted that the bulls were struggling to push price above the recent high and resistance zone at $5333. Now that a week has passed, the bears have stepped in and there is a red engulfing candle forming on the weekly chart that could close as a evening Read More…
What Is Divergence In Day Trading
One of the most valuable tools in a trader’s arsenal is the concept of divergence trading, especially in today’s markets. Divergence occurs when the price of an asset and a technical indicator, such as the Relative Strength Index or MACD, move in opposite directions. This can provide insights into the underlying strength or weakness of Read More…
Economic Outlook 2024: What to Expect for Global Growth and Inflation
Global Economic Growth Inflation and Monetary Policy Geopolitical Risks Regional Economic Outlooks
5 Gold Charts That Will Blow Your Mind
1. Gold Price Over Time This chart shows the historical trend of gold prices from 2000 to 2023. Over this period, the price of gold has seen a significant rally, with a notable rise around 2010, peaking at over $1,800 per ounce in 2011. This increase was driven by economic uncertainty and financial crises. After Read More…
NASDAQ Futures (NQ) Bearish Divergence?
Introduction The Nasdaq 100 futures are currently trading around 18,876.75. Over the past month, the index experienced a gain of approximately 5.76% since late April (Barchart.com). This performance is driven by strong corporate earnings from major tech companies like Nvidia and Microsoft, which have posted better-than-expected results. Nvidia’s surge of 9% following earnings and optimistic Read More…
Crude Oil Futures (CL) bounce, long opportunity
A quick recap on our CL analysis done earlier in the week needs to be done as CL has failed to break below the support zone. The bulls stepped back in and the chart has put in a solid bottom candle formation. If we grind down to a shorter time frame, there is a false Read More…
S&P 500 Futures (ES) Struggle Near All-Time Highs
All Time High Resistance ES bulls attempted to break above the all-time high but have failed with a nasty-looking daily candle for the 23rd. This could be an opportunity to short as there is also some small bearish resistance on the RSI. Long Trade Opportunities Short Trade Opportunities News Events Coming Up To Watch Consumer Read More…
Are Crude Oil Futures (CL) About To Plunge?
According to the U.S. Energy Information Administration (EIA), crude oil prices are expected to average around $90 per barrel for the remainder of 2024, driven by OPEC+ production cuts and ongoing geopolitical risks. However, they anticipate a decline to an average of $85 per barrel in 2025 due to increasing global oil production (EIA Homepage) Read More…


