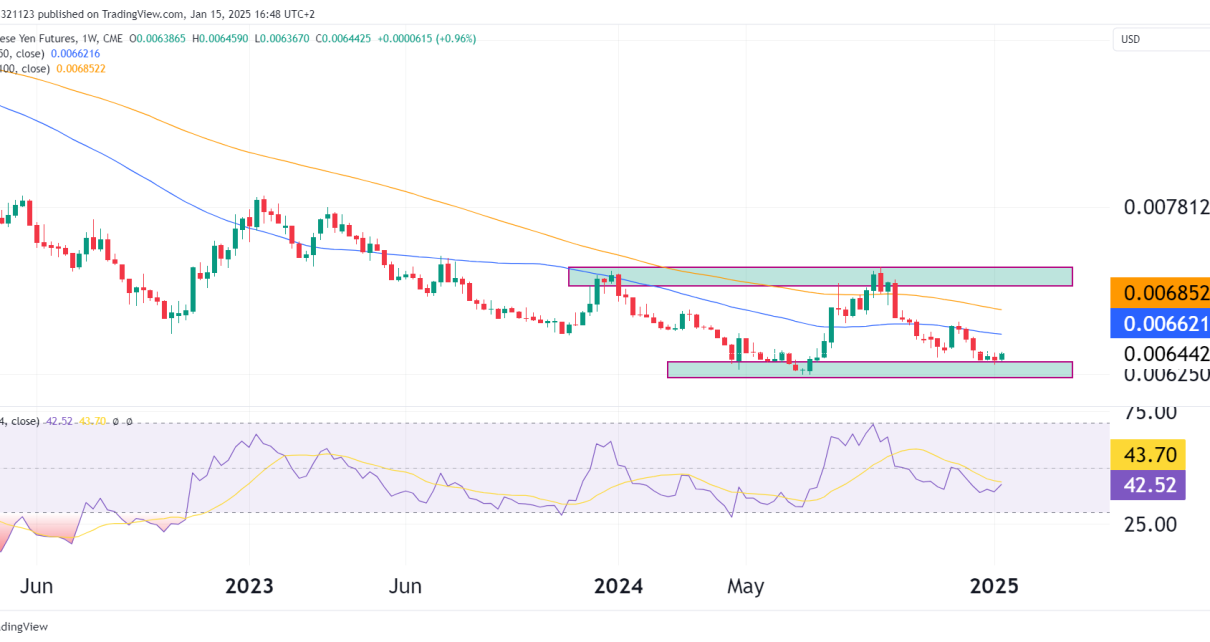
Author
Jay

Warning: Trying to access array offset on value of type bool in /home/blogoneuptrader/public_html/wp-content/themes/mantranews-pro-child-theme/author.php on line 40
Market Overview

Dow Set for Eighth Straight Day of Gains as Rate Cut Hopes Grow

Investors Await Fed Speakers for Insight on Interest Rate Outlook U.S. stock futures rose on Friday, setting the stage for the Dow Jones Industrial Average (YM) to potentially secure its eighth consecutive day of gains. As investors eagerly await a series of speeches from Federal Reserve officials, a growing confidence that a rate cut is Read More…

Technical Analysis

Gold Futures (GC) Bulls Charge Back

Introduction Gold has been the standout so far this quarter as geopolitical tensions persist. It is not only acting as a safe haven, but the chart has some great formations we can take advantage of. The daily chart shows just how strong the trend has been since November 2023, with the 21-week Simple Moving Average Read More…

Technical Analysis

E-Mini Russell 2000 Index Futures Technical Analysis

RTY Chart Overview In this analysis, we’ll take a closer look at the daily chart of the E-Mini Russell 2000 Index Futures, focusing on the potential head and shoulders pattern, support zone, and key technical indicators. Head and Shoulders Pattern The chart highlights a possible head and shoulders pattern, which could lead to a bearish Read More…

Market Overview

Asian Markets Soar as U.S. Rate Cut Hopes Fuel Optimism

MSCI Index Rises and Hong Kong’s Hang Seng Extends Winning Streak The MSCI’s broadest index of Asia-Pacific shares outside Japan saw a slight increase in early trade, while Hong Kong’s Hang Seng index, despite a slight dip, has witnessed an impressive 14% rise over a 10-day winning streak, the longest since 2018. Japan’s Nikkei index Read More…

6E euro FX futures daily cahrt technical analysis
Technical Analysis

Euro FX Futures Technical Analysis

Chart Overview In this analysis, we’ll take a closer look at the daily chart of the Euro FX Futures, focusing on the price movements as 6E has been stuck in a range for over one year. This range is between well-defined support and resistance zones, with the resistance zone at 1.10265, and the support zone Read More…

Technical Analysis

S&P 500 Futures (ES) Technical Analysis: Bulls Are Back

S&P 500 Chart Overview In this analysis, we’ll dive into the daily candlestick chart of the S&P 500 E-mini Futures, focusing on the technicals and chart patterns as ES bulls make a return. ES is up 5% since its low from April and the selling pressure appears to be weaking more and more. Price Action Read More…

Technical Analysis

Crude Oil Futures (CL) Shift From Bullish to Bearish

Overview In this analysis, we’ll take a closer look at the CL futures chart, which displays daily price action along with several technical indicators, including a Simple Moving Average (SMA), Pivot Points (traditional, automatic setting), and the Relative Strength Index (RSI). CL Technical Analysis Trend and Price Action Prices were in an uptrend from February Read More…

Market Overview

FED impending rate decision likely to influence US markets and economy

The Federal Reserve’s Stance on Interest Rates As we look ahead to the coming week, it’s important for us to focus on the Federal Reserve’s stance on interest rates and how it may impact the US economy and financial markets. Fed Chair Jerome Powell has hinted that rates are likely to decrease in 2024, which Read More…