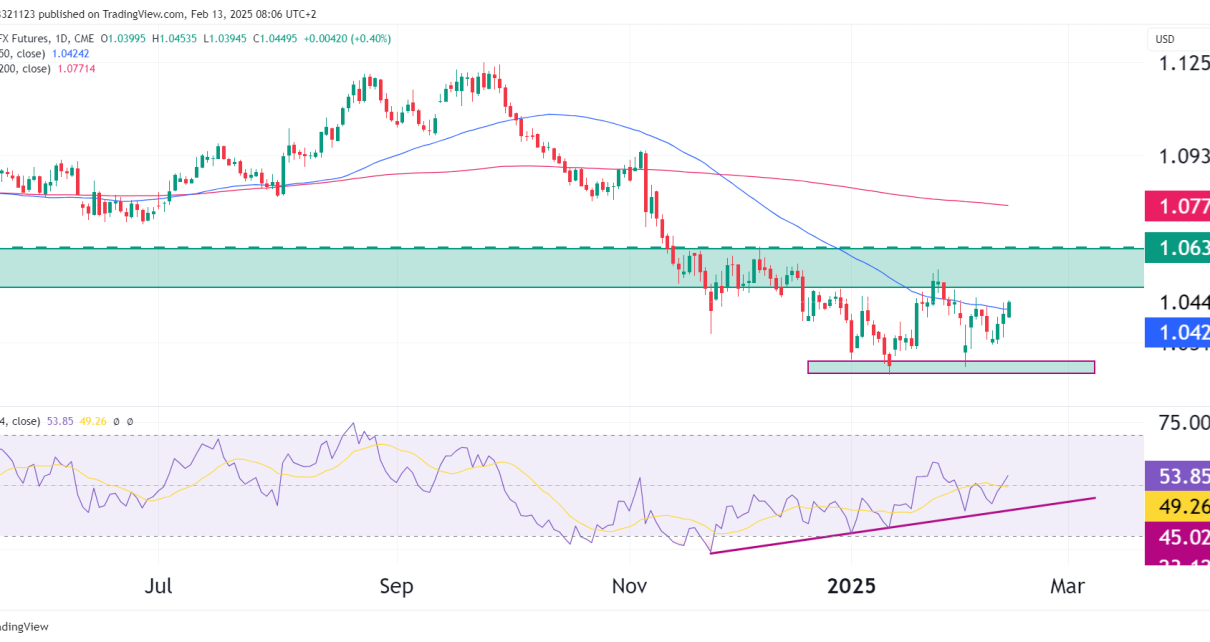
Introduction The Aussy Dollar has been gaining grind like most other currencies as the US Dollar has been weakening. Key Technical Observations: Resistance Level: The price faces strong resistance around the 0.6812 level. This level has been tested multiple times and is holding, suggesting that the bulls are struggling to break through this barrier. Pivot Read More…
Bull & Bear Trades in S&P 500 Futures (ES)
Trend Analysis: The weekly chart for the S&P 500 (ES) futures has been surging alongside all other US equity markets since November of 2023. After a recent break below the trend line, the bulls stepped back in, and the price began its upward movement once more. We should not get euphoric though, there is a Read More…
Will Gold Breach ATH Again?
Introduction Gold futures have continued their steady run upwards, boasting an impressive 31% return over the past year. The question is whether we see this trend continuing. Technical Analysis The daily chart shows us the 50-moving average positioned well above the 100-moving average. There is also a flag formation where gold sat sideways since the Read More…
Crude Oil Futures (CL) Double Bottom In!
Introduction A few days ago, we looked at CL, which was approaching a significant support zone at $72 per barrel. Price continued to fall and hit the support zone and bounced out with strength as bullish buy pressure surged. The daily chart now has a double bottom and a bullish candlestick pattern printed on it that Read More…
Gold Dumps as CPI Increases, Technical Analysis Still Bullish
Recent News US Economic Data: The release of the US Consumer Price Index (CPI) data on August 14 showed a slight increase, which led to fading expectations of an imminent rate cut by the Federal Reserve. This resulted in a minor decline in gold prices, as the likelihood of a rate cut, which would weaken Read More…
How This Funded Trader Profits From Support & Resistance
Trading Strategy Overview Josh, a trader from Connecticut, has received funding in OneUp Trader’s funded trader program by employing a straightforward support and resistance trading approach. His strategy focuses on identifying key levels on the chart and profiting on breakouts and retracements. Many traders use support and resistance levels in their approach, but Josh has Read More…
NASDAQ 100 (NQ) Trade Opportunities
Important Points All-Time High (ATH) Resistance: Support and Resistance Levels: Price Action: Trade Opportunities: Bullish Scenario: Bearish Scenario: Risk Management: Final Call: Overall, the chart is showing a bullish bias, with a key decision point around the ATH. Traders should watch for either a breakout or a rejection to determine the next move.
Crude Oil Futures (CL) Still Stuck In Range
Monthly Chart The monthly chart gives us a good idea of where CL has been sitting since the start of 2023. The longer the price sits in the tight range the stronger the break out will be but at the moment CL is being pushed around a lot by fundamentals. The volume profile point of Read More…
Dollar Index (DXY) Hits Critical Support Level
Introduction The recent decline in the U.S. Dollar Index (DXY) can be attributed to a combination of factors. One of the primary reasons is a shift in market sentiment towards riskier assets. As investor confidence has grown, partly due to strong earnings reports from major companies, there has been a move away from the U.S. Read More…
Buy Opportunity in Dow Jones Futures (YM)
Introduction The Dow Jones has been in a tight ascending triangle on the weekly chart as all US indices continue to surge despite massive geopolitical tensions. At the moment, YM is bouncing off a low and could possibly look to be moving higher for the next few weeks. Lets take a look at the chart Read More…


