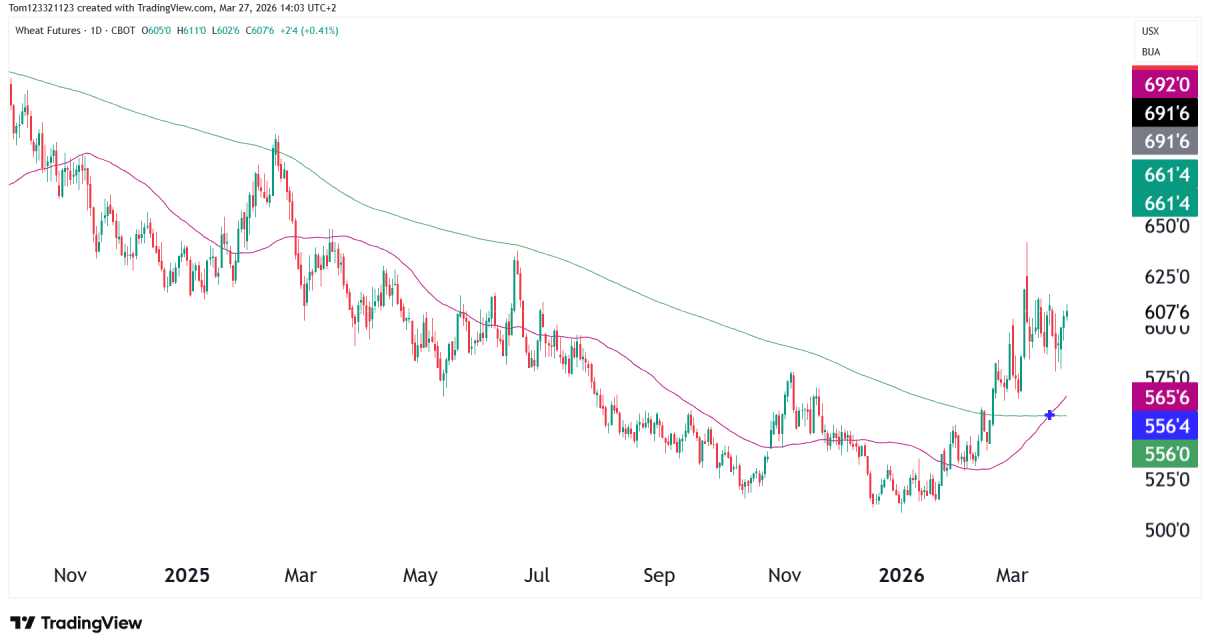
Author
Jay
gold technical analysis
Technical Analysis

Gold Technical Analysis: Triangle Breakout, Eyes on $3,620

Chart Structure Symmetrical Triangle Previous Demand Zone Indicators RSI (14) Pivot Levels Level Description S1 $3,143 Key support/demand base Pivot $3,246 Inside triangle, base for breakout R1 $3,468 Initial resistance on breakout R2 $3,620 Primary measured target R3 $3,792 Stretch target if breakout is impulsive Market Context Trades Bullish Breakout Entry Failure Reversal Watch Bear/Bull Read More…

funded trader oneup trader
Funded Traders Funded Trading Interviews

From Freelancer to Funded Trader: How Nicholas Mastered Bond Futures with OneUp Trader

Introduction Nicholas Patterson from Opelika, Alabama, completed his OneUp Trader evaluation in just 15 days and has been steadily improving ever since. At 33, he works as a freelancer in film and music production while still developing his bond trading strategy. “I enjoy the flexibility that comes with making a profit from the markets,” Nicholas Read More…

crude oil technical analysis
Technical Analysis

Crude Oil Technical Analysis, 6 June 2025

Technical overview Support & Resistance Zone/Level Description R1 ($64.89) Near-term resistance; price now testing. R2 ($68.98) Strong resistance; top of the supply zone. S1 ($56.00) Major support from mid-April low. Pivot ($60.09) Previous consolidation base. Highlighted Supply Zone Momentum & RSI The recent move marks a clear bullish structure of higher lows and higher highs. Read More…

futures trading strategies for beginners
Technical Analysis

Bitcoin Technical Analysis, 5 June 2025

Trend Structure Key Support Levels Level Comment 102,720 (Pivot) Immediate short-term support; being tested. 95,095 (S1) Stronger horizontal 85,060 (S2) Lower support level of the channel uptrend. Resistance Levels Level Comment 110,150 (ATH) Psychological and technical ceiling. 113,755 (R1) Short-term price rejection zone. 122,380 (R2) Upside breakout target post-ATH. Market Psychology Trade Setups Scenario A Read More…

russell 2000 RTY futures OneUp Trader FUnded Trader Program
Technical Analysis

Russell 2000 Lagging S&P 500, Technical Outlook 3 June 2025

RTY Underperformance Weekly Chart of RTY: Structure and Trend Bullish Observations: Caution: Daily Chart of RTY Moving Averages RSI (14) Structure Metric ES (S&P 500 Futures) RTY (Russell 2000 Futures) Trend (Weekly) Strong uptrend Sideways, potential reversal Proximity to ATH ~4% below ATH ~17% below ATH Daily Trend Bullish continuation Range/consolidation RSI Momentum (Daily) Above Read More…

crude oil technical analysis
Technical Analysis

Crude Oil Futures (CL) Technical Analysis, 2 June 2025

Technical Outlook Price Zones Moving Averages Bull and Bear Scenarios Bull Case Bear Case Trade Setups Range Breakout Buy Setup Range Support Bounce Outlook Summary Timeframe Bias Commentary Short-Term Consolidation Attempting breakout of range; test underway at $63 Medium-Term Neutral → Bullish MACD flip, but still under key MAs – breakout above $65 needed Long-Term Read More…

OneUp Trader funded trader lady
Funded Traders Funded Trading Interviews

Stay-at-Home Mom From Pakistani Withdraws $6,050 Using Liquidity Concepts

Introduction This week, we’re featuring an inspiring story from Lahore, Pakistan. At age 26, Shabina has transformed from a housewife with no professional background into a funded trader withdrawing $6,050 from the OneUp Trader funded trader program! Shabina was searching for online work opportunities and discovered trading through YouTube. What started as curiosity became real Read More…

Nasdaq 100 futures (NQ)
Technical Analysis

NASDAQ 100 Futures (NQ) Technical Analysis, 30 May 2025

Technical analysis Zones Bull & Bear Cases Bull Case (higher probability) Bear Case (moderate risk) Trade Ideas Breakout Buy Opportunity (Momentum Continuation) Support Bounce Buy (Mean Reversion) Trades to Avoid Final Outlook Timeframe Outlook Bias Commentary Short-Term Consolidation Neutral-Bullish Price digestion after strong run-up Medium-Term Uptrend intact Bullish Higher lows, reclaim of MAs, poised for Read More…

6E euro dollar after donald trump victory
Technical Analysis

Technical Analysis Euro FX Futures (6E), May 29 2025

Price Structure & Technical Levels Momentum and Squeeze Probabilities Timeframe Bull Case Bear Case Probability Short-Term (1–2 weeks) Break above 1.1300 leads to quick test of 1.1450–1.1613 Failure at 1.1300 leads to pullback to 1.1198 and possibly 1.1120 Neutral-to-Slightly Bullish (55%) Medium-Term (2–6 weeks) Retest and hold of trendline, breakout toward 1.1720 Breakdown below 1.1180 Read More…

dow jones technical analysis
Technical Analysis

Dow Jones Futures (YM) Technical Analysis – May 27, 2025

Technical Analysis Structure and Trend Any clean break above the 200-day MA opens room toward the all-time high (~43,564). A bullish “golden cross” is not yet active, but a sustained breakout could tilt momentum in that direction. Probabilities Scenario Description Probability Targets Bullish Continuation Holds trendline and breaks above 200-MA High 42,557 → 43,564 (ATH Read More…