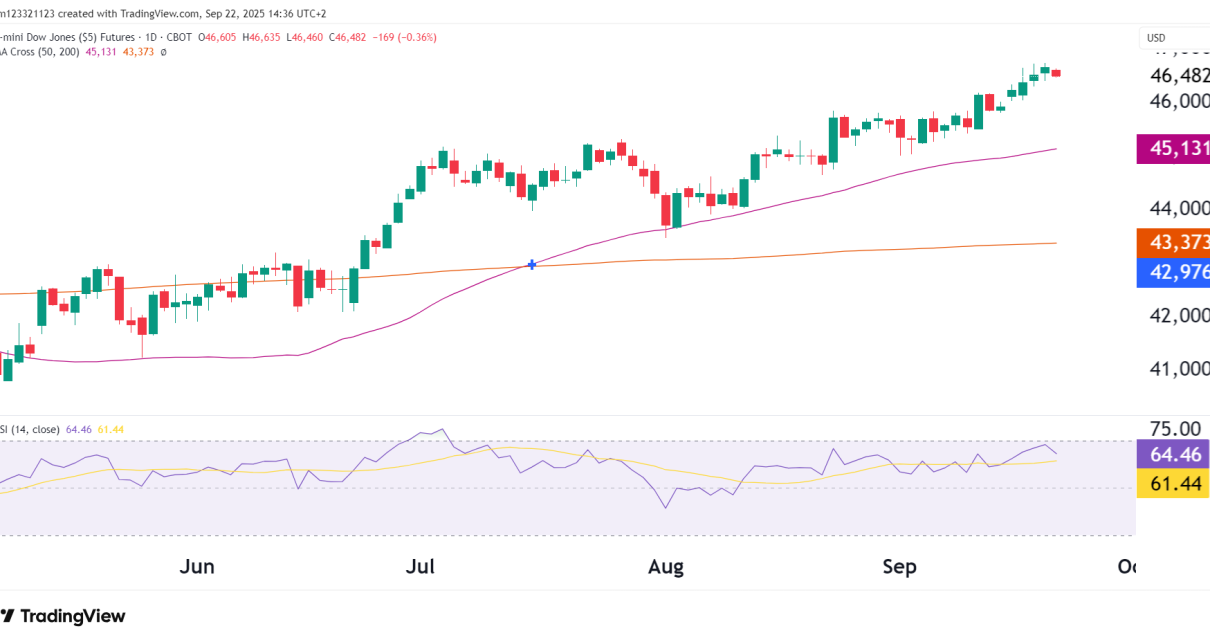
Author
Jay

Warning: Trying to access array offset on value of type bool in /home/blogoneuptrader/public_html/wp-content/themes/mantranews-pro-child-theme/author.php on line 40
Technical Analysis

Technical Analysis Euro FX Futures (6E), May 29 2025

Price Structure & Technical Levels Momentum and Squeeze Probabilities Timeframe Bull Case Bear Case Probability Short-Term (1–2 weeks) Break above 1.1300 leads to quick test of 1.1450–1.1613 Failure at 1.1300 leads to pullback to 1.1198 and possibly 1.1120 Neutral-to-Slightly Bullish (55%) Medium-Term (2–6 weeks) Retest and hold of trendline, breakout toward 1.1720 Breakdown below 1.1180 Read More…

Technical Analysis

Dow Jones Futures (YM) Technical Analysis – May 27, 2025

Technical Analysis Structure and Trend Any clean break above the 200-day MA opens room toward the all-time high (~43,564). A bullish “golden cross” is not yet active, but a sustained breakout could tilt momentum in that direction. Probabilities Scenario Description Probability Targets Bullish Continuation Holds trendline and breaks above 200-MA High 42,557 → 43,564 (ATH Read More…

Technical Analysis

U.S. Dollar Index (DXY) – Technical Analysis May 27, 2025

Technical Analysis Breakdown Summary Bearish Signals Downside Targets if 98.50 breaks: Bullish Counterpoints Bias Probability Trigger/Confirmation Target/Range Bearish Continuation 65% Break and close below 98.50 97.50 → 96.90 zone Short-Term Bounce 35% Reclaim of 100.64 + RSI > 50 101.18 (50 MA), then 103.36 (R1) Key Levels to Watch Type Level Significance Resistance 100.64 Former Read More…

Technical Analysis

S&P 500 E-Mini Futures (ES) Technical Analysis – May 26 2025

Technical Analysis Bullish Developments Bullish Case (High Probability) Probability: 65% Bearish Case (Low Probability for Now) Probability: 35% Key Technical Levels Type Level Commentary Resistance 5,962.75 R1 pivot — breakout confirmation trigger ATH Target 6,170.00 Next major resistance Support 5,809.13 200-day MA – reclaimed Support 5,618.52 50-day MA Key Support 5,397.50 May swing low – Read More…

gold technical analysis
Technical Analysis

Gold Technical Analysis Long/Near Term: May 23, 2025

Overview Gold futures (COMEX: GC) continue to trade near record highs with massive long-term momentum and short-term consolidation. Price could be coiling up for another bullish breakout. With macroeconomic uncertainty, a weakening U.S. dollar, central bank demand, and inflation hedging flows underpinning sentiment, gold remains the strongest major asset class of 2025. Monthly Chart RSI Read More…

futures trading strategies for beginners
Technical Analysis

Bitcoin Hits All-Time High: Technicals (BTC Futures)

Chart Context Bitcoin has exploded through its previous all-time high. The price is now above the psychological and technical resistance at $110,150. The breakout confirms the continuation of the uptrend after a 32% pullback, which lasted four months. Technical Analysis ATH Breakout Confirmed RSI at 74.76 – Overbought, but Not Diverging Support Zones Next Price Read More…

oneup trader funded trader program
Funded Traders Funded Trading Interviews

Machine Operator Withdraws $6,600 From Funded Account in Just 10 Days!

Introduction This week, we are featuring a new funded trader from Odessa, Texas, who, with persistence and clarity, withdrew an impressive $6,600 from his funded account in just 10 days! Michael M is a machine operator who has now made his fourth withdrawal from the OneUp Trader funded trader program, bringing his total to $11,320! Read More…

crude oil technical analysis
Technical Analysis

Bull & Bear Tug of War in Crude Oil Futures (CL)

Technical Analysis Price Action and Structure Volume Profile The high volume node near $61–63 shows this region is a fair value zone—prices above may accelerate upward if there’s a strong breakout. Notice the very thin volume just above $64, if price moves above this level we could see it accelerate very quickly. Bullish Case Catalysts: Read More…

Technical Analysis

Where to From Here for the Dollar?

Technical Analysis Adaptive Momentum Oscillator (AMO): Bearish Reversal Signal This is the first red histogram since April, and it’s emerging near resistance. Scenarios 🟢 Bull Case (Less Likely Short-Term) Catalysts: Hot inflation surprise, stronger U.S. growth, Fed re-hawkishness 🔴 Bear Case (Favored Short-Term) Catalysts: Weak economic data, risk-on flows, further Fed cut pricing, strong euro Read More…

Technical Analysis

Euro FX Futures (6E) – Can the Bulls Reclaim the Uptrend?

Introduction Technical Analysis After a strong breakout above 1.13 in April, 6E has pulled back modestly, retracing toward the 50-day moving average and prior support at ~1.114–1.117. Buyers stepped in at that level, and we are now seeing an attempt to regain upside momentum. Price is currently retesting the pivot zone at 1.127, which is Read More…