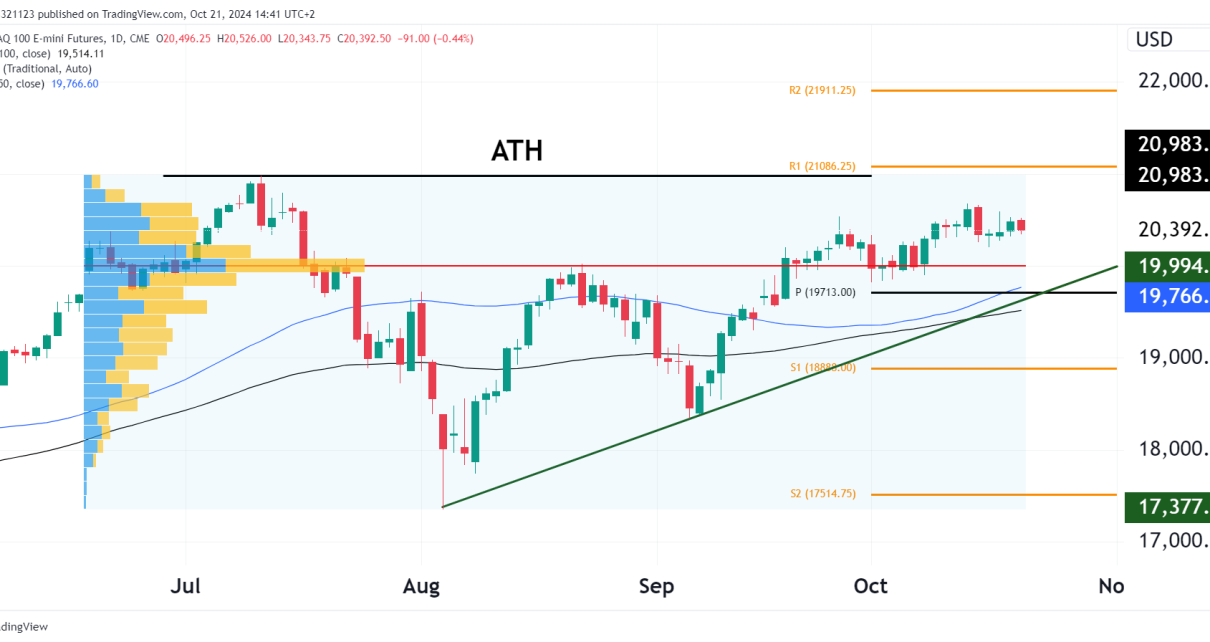
Author
Jay

Warning: Trying to access array offset on value of type bool in /home/blogoneuptrader/public_html/wp-content/themes/mantranews-pro-child-theme/author.php on line 40
Technical Analysis

Dollar falling again? Technical outlook

Weekly Chart The U.S. Dollar shows a symmetrical triangle pattern, which is typically indicative of a continuation or a reversal pattern depending on the breakout direction. Price is sitting at the top end of the triangle and is also in a multi-year support/resistance zone. Key Levels to Watch on the Weekly: Daily Chart On the Read More…

Technical Analysis

Light Crude Oil Futures: Technical Outlook

Weekly Chart AnalysisThe Light Crude Oil Futures on the weekly chart have a clear consolidation pattern within a defined support zone. Volume Profile Visible Range (VPVR) indicates substantial trading activity at these levels. The Relative Vigor Index (RVI) is setting a steady momentum, with the RVI line slightly above its moving average, indicating a slight Read More…

Strategies

Andrews Pitchfork Trading Strategies

Andrews Pitchfork Andrews Pitchfork is a technical analysis indicator developed by Dr. Alan Andrews in the 1960s. It has become a widely used tool among traders and technical analysts. The indicator consists of three parallel trendlines drawn on a price chart. The middle trendline connects two extreme points, usually a peak and a trough. The Read More…

Market Overview

Nasdaq Futures Jump as NVIDIA reports earnings

Nasdaq futures jumped approximately 2% Thursday morning following a strong earnings report from Nvidia, a leader in AI chip design. The company exceeded Q4 revenue expectations and projected Q1 revenue to triple, fueled by robust demand for its artificial intelligence chips.  In premarket activity, Nvidia shares skyrocketed 12.9%, poised to add over $200 billion to its market Read More…

Market Overview

Japan’s Nikkei Soars to Peaks Unseen Since 1980s

Japan’s stock market has reached new heights not seen since the country’s asset bubble in the late 1980s. Back then, share prices soared to astronomical levels, fueling a national mood of affluence and speculation. 87-year-old investor Kazukuni Yamazaki recalls the spectacle of daily stock fluctuations drawing crowds of eager onlookers, including young office workers. Luxury Read More…

Market Overview

Gold Prices Show Resilience, Poised for Further Gains

Gold prices have demonstrated remarkable resilience in recent weeks, rebounding from dips and maintaining an upward trajectory overall. This precious metal’s recovery is attributed primarily to the weakening of the US dollar and lower Treasury bond yields, both of which enhance gold’s appeal as an investment hedge. Technical analysts have identified key support levels around Read More…

futures trading strategies for beginners
Technical Analysis

Bitcoin Surges above $52,000; Upside Expected

Weekly Chart The weekly time frame shows that price is approaching the previous all-time high, a big milestone for Bitty. The swing high extensions (Swing:SH Ext at 32165) serve as a reference point for potential resistance on further moves up. This swing indicator will likely print a higher low soon around $40,000. Key Levels to Read More…

Technical Analysis

S&P 500 Futures (ES) hanging man?

Weekly On the weekly chart, there is a hanging man candlestick, which may lead to a reversal or a significant pause in the uptrend. Given the strong uptrend with 14 green candles in the past 16 weeks, we would need further confirmation before considering this a top. Volume has been relatively steady, without any significant Read More…