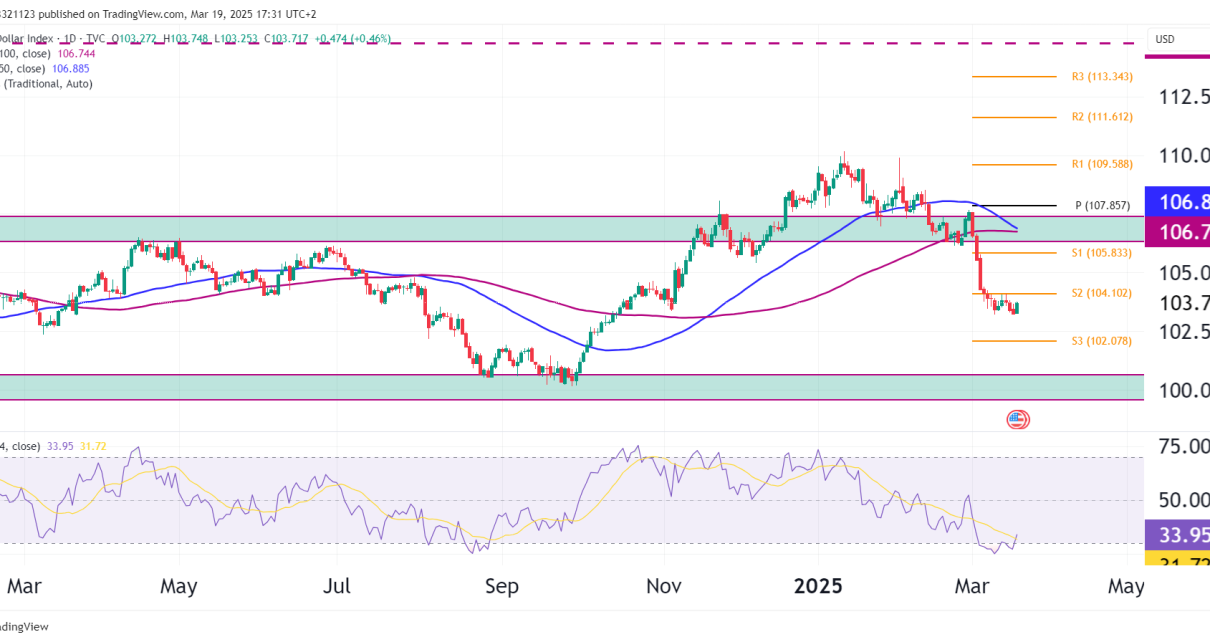
Introduction Bitcoin has plunged to levels not seen since February, briefly dipping below the $50,000 mark. This dramatic sell-off comes just days after Bitcoin was flirting with the $70,000 level. This is part of a broader market sell-off triggered by renewed recession fears, as even the big indices started falling on Monday. Investors, already on Read More…
How Greg Banked $3,7K in OneUp Traders Funded Trader Program
Introduction Meet Greg, a price action trader in OneUp Trader’s funded trader program who has made his mark with a straightforward yet effective approach to the markets. Greg recently made a withdrawal of $3,700 from his funded trading account, and today, we are going to find out just how he did it. Trading style and Read More…
Crude Oil Futures (CL) Surges on EIA Report
Introduction CL Futures saw a huge rally of 5% yesterday as the EIA showed a larger than expected drawdown in stock piles. This has given bulls new hope that CL can break above $80 and possible head toward $100 in the future. Recent News Geopolitical Tensions: Escalating geopolitical tensions in the Middle East raised concerns Read More…
Russell 2000 Futures could blast past ATH next week
Introduction We looked at the break out in RTY two weeks back, and now, the daily chart is forming a pennant chart pattern. The penant formation is a high probability chart pattern that can lead to a big swift move initially which is why we think we could see RTY break its ATH next week or the Read More…
Technical Analysis Dow Jones Futures (YM)
Market Overview As of July 30, 2024, the E-mini Dow Jones Futures are trading at 40,788. We’ve seen a consistent uptrend over the past few months, marked by higher highs and higher lows. The price action is currently hovering around a significant resistance level which is the previous ATH, testing the 40,800 zone. At the Read More…
NASDAQ Futures (NQ) Surge Incoming?
Price Action and Trend NQ, like all other equity markets, has been in a strong uptrend since October 2023. However, we’ve recently seen a sharp pullback from the all-time high of around 20,983.00, and now could be the time to look to take long positions. Support and Resistance Moving Averages The price is currently between Read More…
NASDAQ Futures (NQ) Technical analysis
Weekly Chart I have put a volume profile indicator onto last weeks trading which is shown in the weekly chart below. Price is sitting now just above the support where last weeks candle closed. The Point of control line is holding the price up for now and after the recent dip in the US equity Read More…
Technical Analysis of Canadian Dollar Futures
Technical Analysis Trend and Moving Averages: The RSI is also at oversold territory adding further fuel to the possibility of a price pump from here. Technical Patterns Support and Resistance Levels: Trade Opportunities Long Position Given the RSI at oversold and the price at the lower Bollinger Band, a high-probability trade setup for a long Read More…
S&P 500 Futures (ES) reversal or buying opportunity?
Introduction On July 24, the S&P 500 closed at 5,427.13; this marks almost a 5% drop from the previous high. This drop follows a series of mixed performances over the last week. The volatility is attributed to significant losses in major tech stocks and companies within the utilities sector. Notably, shares of Vistra Corp. and Read More…
Time to short the Japanese Yen (6J)?
Introduction There is an interesting pattern on the 6J daily chart that we could take advantage of. Since the middle of 2021, the Yen has been in a downtrend compared to the Dollar, but we want to look at the retracements during that period. Putting a 50 and 100 sma on the chart, there is Read More…