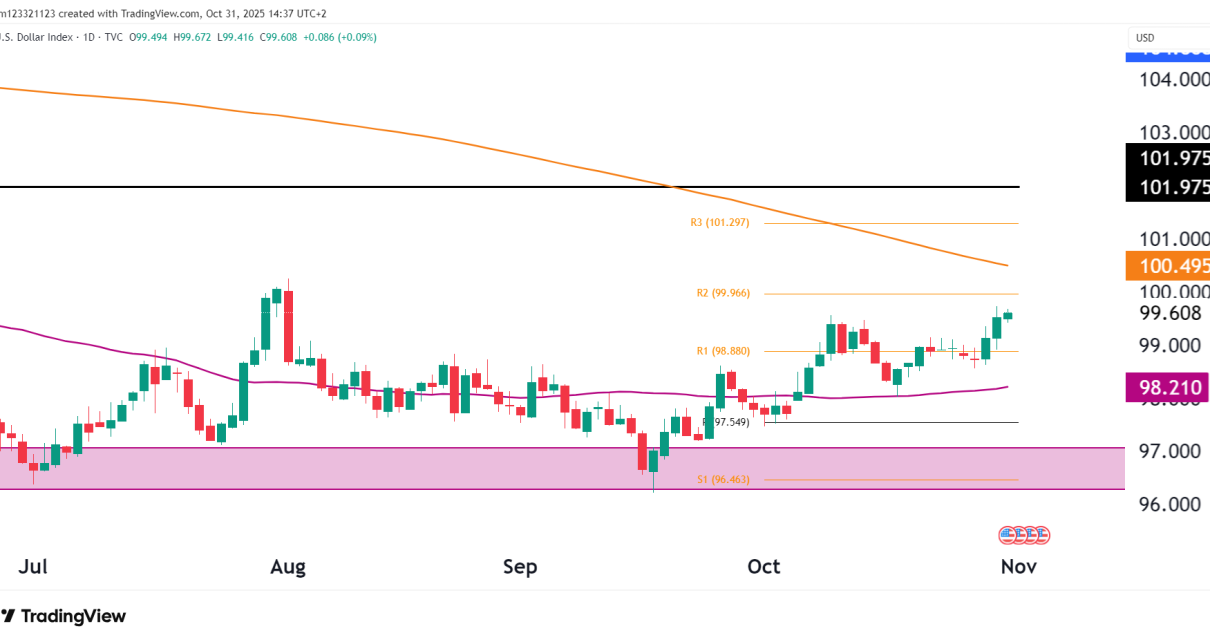
Author
Jay

Warning: Trying to access array offset on value of type bool in /home/blogoneuptrader/public_html/wp-content/themes/mantranews-pro-child-theme/author.php on line 40
Uncategorized

Unlocking Trading Success with the Fisher Transform Indicator

Trading the financial markets can be tough. As traders, we’re constantly searching for that edge – tools that give us an advantage and increase our chances of profitable trades. In my experience, the Fisher Transform indicator has proven to be one such powerful tool. In this article, I’ll explain how I use this indicator in Read More…

gold technical analysis
Technical Analysis

Gold Futures (GC) Technical Analysis, August 13 2025

Market Snapshot Metric Value Current Price 3,402.8 Day’s Change +3.8 (+0.11%) 50-Day MA 3,373.0 200-Day MA 3,037.4 Key Resistance 3,430–3,450 (ATH zone) Key Support 3,345–3,350 (trendline & 50DMA confluence) Technical Overview Trend & Structure Gold remains in a long-term uptrend, holding above its ascending trendline from the March lows. The recent push to new all-time Read More…

Euro fx futures technical analysis
Technical Analysis

Euro Futures (6E) Technical Analysis, 12 August 2025

Market Snapshot Metric Value Current Price at time of writing 1.16395 50-Day MA 1.16444 200-Day MA 1.09894 Key Resistance 1.1700 – 1.1800 Key Support 1.15625 (range floor), 1.14250 (major swing low) Technical Overview Weekly Chart The weekly chart is a good way to show the strength of the long-term trend of any asset. The Dollar Read More…

Technical Analysis

Nasdaq Futures (NQ) Rally Continues, 11 August 2025

Introduction Nasdaq (NQ) futures are close to making new highs again after a short but sharp 4.4% pullback. Market Snapshot Metric Value Current Price As Of Article 23,738.50 Day’s Change +24.75 (+0.10%) 50-Day MA 22,707.56 200-Day MA 21,208.43 Pivot Point (P) 23,264.00 Key Resistance Levels 23,946 (R1), 24,527 (R2), 25,209 (R3) Key Support Levels 23,264 Read More…

crude oil technical analysis
Technical Analysis

Crude Oil Futures (CL) Technical Analysis, 8 August

Technical Overview Trend and Structure Momentum & Volatility Key Technical Levels Level Type Description 68.50 Pivot (P) Prior rejection level, key resistance 66.61 50DMA Broken support turned resistance 62.31 S2 First strong support test 59.94 S3 Critical downside level 71.62 R1 Bullish breakout reclaim level Probability Table Scenario Estimated Probability Commentary Continuation lower to test Read More…

Technical Analysis

S&P 500 (ES) Technical Analysis, 7 August 2025

Market Snapshot Metric Value Price as of 7 August 6,385.25 Day’s Change +14.25 (+0.22%) 50-Day MA 6,201.13 200-Day MA 5,940.58 14-Day RSI 59.02 Technical Overview Price Structure & Trend Momentum & RSI Key Technical Levels Level Type Significance 6,450–6,460 Resistance All-time highs zone 6,290–6,300 Support Recent low and short-term demand zone 6,201 50MA Strong trend Read More…

Technical Analysis

Nasdaq Futures (NQ) Technical Analysis, 5 August 2025

NQ Daily Chart Price as of 5 August 2025: 23,366.7550-day MA: 22,529.31200-day MA: 21,147.31Pivot (P): 23,264.00Recent Lows: 22,820–22,850 (just above S1)Resistance Zones: Technical Breakdown Short-term Rebound Attempt Structure & Caution Flags Probabilities Table Scenario Estimated Probability Commentary Reclaim R1 (~23,946) and trend resumes 35% Needs strong follow-through and breadth Chop in 22,700–23,700 range 45% Most Read More…

Uncategorized

Dow Jones Technical Analysis, August 4 2025

Chart Overview – Daily Timeframe (YM) Current Price: 43,865Change: +155 (+0.35%)50-day MA: 43,661200-day MA: 43,060RSI (14): 43.90 — declining momentumATH (All-Time High): ~45,280 (not reclaimed) Technical Analysis Structure & Momentum: Risk Zones: Market Context Relative to Other US Indices: Macros in Play: Probability Table Scenario Estimated Probability Commentary Reclaim ATH and push above 45,300 20% Read More…

gold technical analysis
Technical Analysis

Gold (GC) Technical Analysis, 1 August 2025

Current Price: 3,342.30Change: -6.30 (-0.19%)ATH: ~3,51050-day MA: 3,355.4200-day MA: 3,008.8RSI (14): 48.45 (Neutral to Weakening) Gold Trend This Year Technical Analysis Technical Context Indicator / Feature Current Reading Implication Price vs ATH ~170 pts below ATH Consolidation under key resistance 50-day MA Price sitting on it Neutral support test Trendline (YTD) Still holding Break would Read More…